Page: 1
/ 14
Total 50 questions
Adobe Analytics Business Practitioner Expert AD0-E208 Exam Questions
Question 1
An analyst has been given a list of dimensions available to conduct an analysis on their hospital's doctor site.
The Solution Design Reference (SDR) contains:
eventl - Start Appointment Booking - Set on: Appointment Booking Start
event2 - Booking Complete - Set on: Appointment Booking Complete
eVarl - Doctor Type - Set on: event2
eVar2 - Number of Available Appointments - Set on eventl
propl -Appointment Pathing
Given the SDR, which report can be generated?
Answer : A
Given the SDR, the report that can be generated is Booking Completion Rate. This is a measure of how many visitors who started an appointment booking completed it. It can be calculated by dividing event2 (Booking Complete) by event1 (Start Appointment Booking). The other reports, Time to Book an Appointment and Length of Appointments, cannot be generated with the given SDR, as they require additional variables or data sources.
References: https://experienceleague.adobe.com/docs/analytics/components/metrics/calculated-metrics.html?lang=en https://experienceleague.adobe.com/docs/analytics/components/metrics/calculated-metrics.html?lang=en#calculated-metric-examples
Question 2
The web analyst for a beauty products company wants to create a report to analyze the number of sample requests for one of their product pages.
The following items are available from the default configuration:
* prop3, which registers the product page name and is fired in the first page load
* eVar4, which registers the product page name and is fired in the first page load
* event1 2, which fires when a visitor clicks on "Request a sample'' call to action
How can the analyst accomplish the creation of this report?
Answer : C
The best way to create a report to analyze the number of sample requests for one of their product pages is to use eVar4 in combination with event12 as a metric. eVar4 registers the product page name and is fired in the first page load, so it will capture and persist the value for each visit. event12 fires when a visitor clicks on ''Request a sample'' call to action, so it will measure the number of sample requests. Using eVar4 as a dimension and event12 as a metric will show how many sample requests were made for each product page. Using prop3 instead of eVar4 will not work, as prop3 does not persist across hits or visits.
References: https://experienceleague.adobe.com/docs/analytics/components/variables/conversion-variables/conversion-var-overview.html?lang=en https://experienceleague.adobe.com/docs/analytics/components/variables/traffic-variables/traffic-var-overview.html?lang=en
Question 3
When creating a calculated metric, how far back does the preview show data for?
Answer : A
When creating a calculated metric, the preview date range can be selected by using the ''Preview Date'' drop-down in the Calculated Metric Builder. This will allow you to see how your calculated metric performs for different periods of time, such as last week, last month, last quarter, etc.
References: https://experienceleague.adobe.com/docs/analytics/analyze/analysis-workspace/calculated-metrics/calculated-metrics-overview.html?lang=en https://experienceleague.adobe.com/docs/analytics/analyze/analysis-workspace/calculated-metrics/calculated-metrics-overview.html?lang=en#previewing-a-calculated-metric
Question 4
A data analyst wants to create a segment of traffic that started on the page "Facebook App Home" and accessed the "Home Page" in Analysis Workspace.
Based on the project presented below:
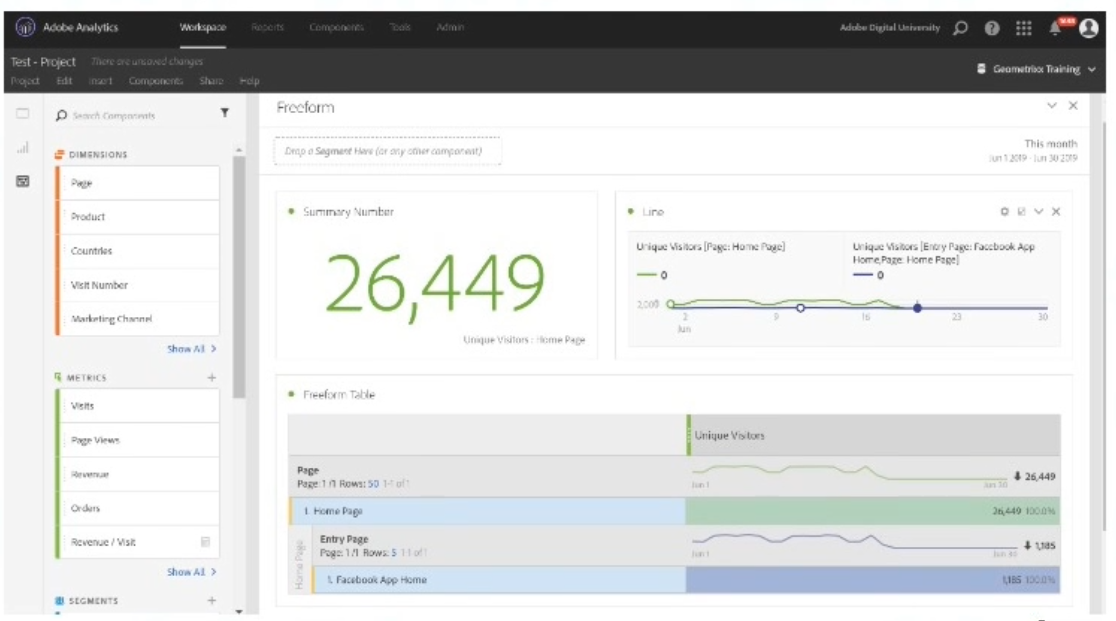
What is the proper way to create this segment and continue working on the project without loss of data?
Answer : C
The proper way to create a segment of traffic that started on the page ''Facebook App Home'' and accessed the ''Home Page'' in Analysis Workspace is to click on the Internal Menu of the Components project, then on New Segment, and create a segment of a VISIT container with entry page equals ''Facebook App Home'' AND page equals ''Home Page''. This will ensure that the segment captures only the visits that meet both criteria within the same visit. Clicking and selecting ''Home Page'' and ''Facebook App Home'' in the table and creating a segment from selection will not work, as it will create a segment of a HIT container with page equals ''Home Page'' OR page equals ''Facebook App Home'', which is not what is required. Clicking on the Main Menu Components and creating a new segment of a VISITOR container with entry page equals ''Facebook App Home'' AND page equals ''Home Page'' will not work either, as it will capture visitors who met both criteria across different visits, which is also not what is required.
References: https://experienceleague.adobe.com/docs/analytics/components/segments/create-segments-in-analysis-workspace.html?lang=en https://experienceleague.adobe.com/docs/analytics/components/segments/create-segments-in-analysis-workspace.html?lang=en#creating-a-segment-from-a-table
Question 5
In which order are these data components processed?
Answer : A
The order in which these data components are processed is page code > VISTA Rules > Marketing Channel Rules > Processing Rules. This means that page code is processed first, then VISTA Rules are applied on top of page code data, then Marketing Channel Rules are applied on top of VISTA Rules data, and finally Processing Rules are applied on top of Marketing Channel Rules data.
References: https://experienceleague.adobe.com/docs/analytics/admin/admin-tools/channel-manager/marketing-channels-overview.html?lang=en#data-processing-order https://experienceleague.adobe.com/docs/analytics/admin/admin-tools/channel-manager/marketing-channels-overview.html?lang=en#data-processing-order
Question 6
A spike in traffic is observed for a specific day. Knowing that there are no campaigns running, the first hypothesis is that this is bot traffic.
Which Adobe Analytics tool may be used to identify the IP of the user that contributes to this spike in traffic without using a custom variable?
Answer : A
Data Warehouse is a tool that allows you to run custom queries on raw data and export the results to various formats. It can also provide the IP address of the user as a dimension, which can help identify bot traffic without using a custom variable.
References: https://experienceleague.adobe.com/docs/analytics/export/data-warehouse/data-warehouse.html?lang=en https://experienceleague.adobe.com/docs/analytics/components/dimensions/ip-address.html?lang=en
Question 7
A chart displaying the daily trend of Orders and their performance against the daily average for the last month is needed.
How can this requirement be met?
Answer : A
The best way to display the daily trend of Orders and their performance against the daily average for the last month is to use a Line Visualization to trend the Orders and the daily average as a Calculated Metric in the same chart. A Calculated Metric can be created by using the Average function on Orders and applying a date range of last month. A Line Visualization can show both metrics as lines on the same chart, allowing for easy comparison.
References: https://experienceleague.adobe.com/docs/analytics/analyze/analysis-workspace/calculated-metrics/calculated-metrics-overview.html?lang=en https://experienceleague.adobe.com/docs/analytics/analyze/analysis-workspace/calculated-metrics/calculated-metrics-overview.html?lang=en#creating-a-calculated-metric https://experienceleague.adobe.com/docs/analytics/analyze/analysis-workspace/visualizations/line-visualization.html?lang=en