Page: 1
/ 14
Total 139 questions
ARDMS AE Adult Echocardiography Examination AE-Adult-Echocardiography Exam Questions
Question 1
Which view best demonstrates a wall thickening abnormality of the apical lateral segment?
Answer : A
The two-chamber apical view allows visualization of the left ventricle's anterior and inferior walls, including the apical lateral segment. It is ideal for assessing wall thickness and segmental wall motion abnormalities in this region.
The four-chamber view visualizes septal and lateral walls but does not optimally display the apical lateral segment. Parasternal long axis primarily visualizes the anterior septum and posterior wall but is limited for lateral apex. The mid-parasternal short axis focuses on mid-ventricular segments and does not visualize the apex.
This anatomical and echocardiographic detail is described in the 'Textbook of Clinical Echocardiography, 6e', Chapter on Left Ventricular Segmental Analysis20:120-125Textbook of Clinical Echocardiography.
Question 2
Mid to distal septal akinesis in post-stress imaging of the apical four-chamber view is suggestive of disease in which coronary artery?
Answer : C
The mid to distal interventricular septum is supplied predominantly by the left anterior descending (LAD) coronary artery. Post-stress echocardiography showing akinesis or hypokinesis of these segments is highly suggestive of ischemia or infarction in the LAD territory.
The posterior descending artery supplies the inferior wall, the obtuse marginal supplies lateral walls, and the left circumflex supplies lateral and posterior walls.
This coronary artery segmental relationship is a cornerstone of ischemic heart disease evaluation by stress echocardiography and is well documented in ASE guidelines and clinical echocardiography literature16:Textbook of Clinical Echocardiography, 6ep.380-38512:ASE Stress Echocardiography Guidelinesp.300-310.
Question 3
Which pathology is demonstrated in this video clip?
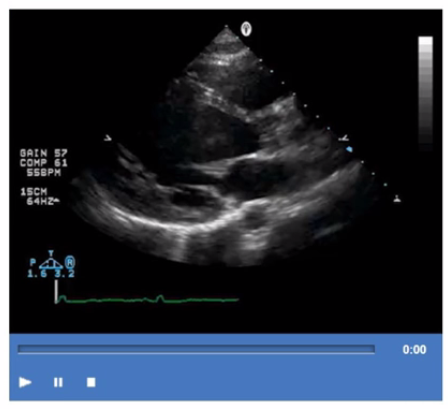
Answer : D
The video shows prominent trabeculations with deep intertrabecular recesses communicating with the left ventricular cavity, characteristic of isolated left ventricular noncompaction (LVNC). This congenital cardiomyopathy features a spongy myocardial appearance with thickened noncompacted layers.
Amyloidosis typically presents with thickened, bright myocardium but without prominent trabeculations. Sarcoidosis involves granulomatous inflammation, and apical hypertrophic cardiomyopathy shows localized hypertrophy without trabecular changes.
This pathology is detailed in the 'Textbook of Clinical Echocardiography, 6e', Chapter on Cardiomyopathies and Myocardial Disorders20:360-365Textbook of Clinical Echocardiography.
Question 4
Which of the following does the pulmonary capillary wedge pressure estimate?
Answer : A
Comprehensive and Detailed Explanation From Exact Extract:
Pulmonary capillary wedge pressure (PCWP) is obtained by advancing a balloon-tipped catheter into a small branch of the pulmonary artery and inflating the balloon to 'wedge' the catheter, thereby occluding forward blood flow and measuring the pressure distal to the occlusion. The measured pressure reflects the pressure in the pulmonary venous system, which closely approximates left atrial pressure (LAP) under normal conditions.
Since the left atrium receives pulmonary venous return before the blood enters the left ventricle, PCWP is a surrogate for LAP, which in turn reflects left ventricular end-diastolic pressure (LVEDP) in the absence of mitral valve disease or pulmonary venous obstruction. PCWP is widely used in clinical and echocardiographic contexts to estimate left heart filling pressures.
It does not estimate right atrial, right ventricular, or left ventricular pressures directly. Right atrial pressure is measured via central venous pressure, right ventricular pressure by catheterization, and left ventricular pressure by direct catheterization.
This concept is extensively discussed in the 'Textbook of Clinical Echocardiography, 6e', Chapter on Hemodynamics and Doppler Assessment, with specific emphasis on the use of PCWP to estimate left atrial pressure20:200-210Textbook of Clinical Echocardiography.
Question 5
Which valve and secondary finding are associated with the 'flying W sign on spectral Doppler and M-mode?
Answer : A
Comprehensive and Detailed Explanation From Exact Extract:
The 'flying W' sign refers to a characteristic spectral Doppler and M-mode pattern observed in the pulmonic valve inflow in patients with pulmonary hypertension. This pattern represents mid-diastolic notching or fluttering caused by increased pulmonary artery pressure and delayed right ventricular relaxation.
This sign is associated specifically with the pulmonic valve and pulmonary hypertension, not with prostheses or tricuspid valve pathology.
This finding is discussed in echocardiography and pulmonary hypertension guidelines and texts16:Textbook of Clinical Echocardiography, 6ep.280-28512:ASE Pulmonary Hypertension Guidelinesp.300-305.
Question 6
Which congenital heart anomaly is found in approximately 30% of normal adults?
Answer : C
Patent foramen ovale (PFO) is a common congenital cardiac anomaly found in approximately 25-30% of the adult population. It represents incomplete closure of the foramen ovale after birth and is usually asymptomatic.
Cleft mitral valve and bicuspid aortic valve are less common congenital anomalies, and hypertrophic cardiomyopathy is a genetic myocardial disease, not an anomaly.
This prevalence and clinical significance are discussed in the 'Textbook of Clinical Echocardiography, 6e', Chapter on Atrial Septal Defects and Common Anomalies20:110-115Textbook of Clinical Echocardiography.
Question 7
Which mitral valve filling pattern is characterized by a long deceleration time and an E/A ratio of 0.6?
Answer : C
The mitral valve filling pattern characterized by a long deceleration time and a reduced E/A ratio (less than 1, such as 0.6) is consistent with impaired relaxation. This pattern is typically seen in early diastolic dysfunction, where there is slowed ventricular relaxation, resulting in reduced early diastolic filling (E wave) and a compensatory increase in atrial contraction contribution (A wave).
Impaired relaxation pattern shows:
E/A ratio < 1 (e.g., 0.6)
Prolonged deceleration time (>200 ms)
Prolonged isovolumic relaxation time (IVRT)
This pattern differs from restrictive filling, which has a high E/A ratio (>2), shortened deceleration time (<150 ms), and elevated left atrial pressures. Pseudonormal filling has a normal or near-normal E/A ratio but elevated filling pressures that mask underlying dysfunction and requires further evaluation with tissue Doppler or pulmonary venous flow for diagnosis. Normal filling has a typical E/A ratio around 1 to 1.5 with normal deceleration times.
The textbook details that impaired relaxation is the earliest sign of diastolic dysfunction and describes the prolongation of the deceleration time and reduced E/A ratio as hallmark findings of this stage.
 All Official Question Types