Page: 1
/ 14
Total 175 questions
ASQ Quality Engineer CQE Exam Questions
Question 1
The following data sets were presented to top management.
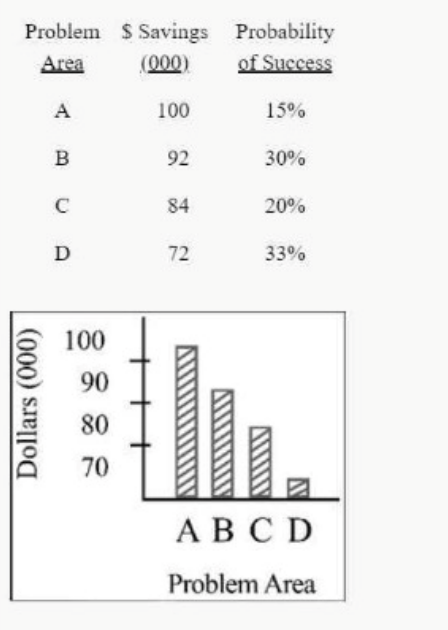
Which problem area should be targeted for improvement first?
Answer : B
To determine which problem area should be targeted for improvement first, we need to consider both the dollar savings and the probability of success. Calculating the expected savings (dollar savings multiplied by the probability of success) for each problem area gives us a clear picture:
A: 100,000 * 0.15 = 15,000
B: 92,000 * 0.30 = 27,600
C: 84,000 * 0.20 = 16,800
D: 72,000 * 0.33 = 23,760
Problem Area B has the highest expected savings (27,600), making it the best target for initial improvement efforts based on the given data. Reference:
Quality Management for Organizational Excellence by David L. Goetsch and Stanley Davis.
ASQ Certified Manager of Quality/Organizational Excellence Handbook.
Question 2
Which of the following elements of a quality system will help reduce errors and defects caused by conflicting work instructions?
Answer : C
Document control is a critical element of a quality system that ensures that all work instructions, procedures, and specifications are up-to-date, consistent, and accessible to relevant personnel. Proper document control helps prevent errors and defects caused by outdated or conflicting work instructions.
ISO 9001:2015. (2015). Quality Management Systems -- Requirements. ISO.
ASQ. (n.d.). Document Control. Retrieved from https://asq.org/quality-resources/document-control
Question 3
Which of the following statements describes discrete data?
Answer : B
Question 4
The design function which assigns probability of failures between components or subsystems is called
Answer : A
Question 5
A graph of a data set, composed of a series of rectangles, each proportional in width to the range of values in a class and proportional in height to the number of items or fraction of items falling in these classes, is called which of the following?
Answer : A
Question 6
An engineer has been asked to identify and apply an absolutely objective metric to evaluate risk. The best response is
Answer : A
An absolutely objective way to measure risk does not exist. Risk assessment inherently involves some level of subjectivity due to the uncertainty and variability in processes and outcomes. While various tools and metrics (e.g., lean metrics, six sigma metrics, quality function deployment) can aid in evaluating and managing risk, none provide an entirely objective measure. Reference: 'Risk Management: Concepts and Guidance' by Carl L. Pritchard, which discusses the challenges of achieving absolute objectivity in risk assessment.
Question 7
As a commonly used problem solving technique, which of the following would be the BEST application of a Pareto chart?
. To determine when to make proactive adjustments to a process.
. To differentiate between major and minor problem areas.
. To gather data and to design experimental controlled changes.
. To evaluate the results of other problem solving techniques upon the product or service.
Answer : C