Page: 1
/ 14
Total 230 questions
ASQ Six Sigma Black Belt CSSBB Exam Questions
Question 1
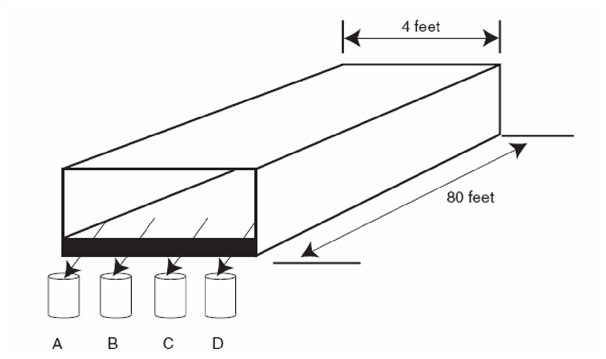
SCENARIO
A Six Sigma team is measuring the moisture content of corn starch as it leaves the conveyer belt of a dryer. They collect one sample four cups of starch at times indicated in the chart at fixed locations labeled A, B, C, and D across the end of the belt. See the diagram below.
After some work on the dryer, additional data are collected which when plotted looks like this:
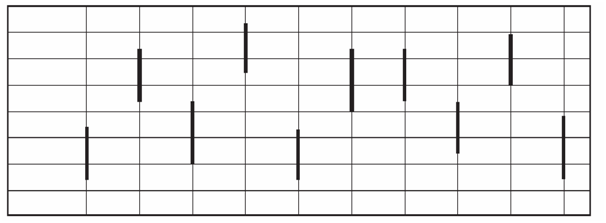
Which type of variation dominates?
Answer : B
Question 2
A quality leader who did extensive work with Japanese industry is:
Answer : F
Question 3
A quality engineer employed by a hospital is asked to improve the process of medication storage in locked cabinets near patient doors. One defect that occurs rarely is that the medication caddy is left out when the cabinet is relocked. The engineer installs a gravity activated arm that will not permit the door to close when the caddy isn't inside. This improvement is best described by which approach to problem solving?
Answer : B
Question 4
If the probability that event A occurs is .51, the probability that event B occurs is .64 and events A and B are statistically independent then:
Answer : B
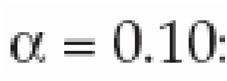
Question 5
= 0.05
A sample of size 50 from machine A has a mean of 18.2 and standard deviation 3.1. A sample of size 40 from machine B has mean 17.6 and standard deviation 2.8. Do these data indicate that the population for machine A has a larger mean? Assume the populations are normal.
Answer : B
Question 6
A random sample of 2500 printed brochures is found to have a total of three ink splotches. The rate of ink splotches in PPM is:
Answer : C
Question 7
Find the value of (12) in the ANOVA table.
Assume:
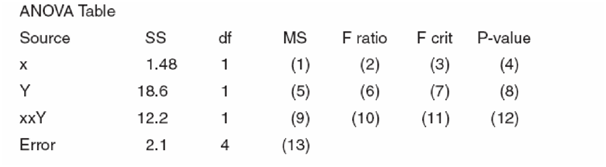
Answer : N