Page: 1
/ 14
Total 232 questions
ECDL ADVANCED WORD PROCESSING ECDL-ADVANCED Exam Questions
Question 1
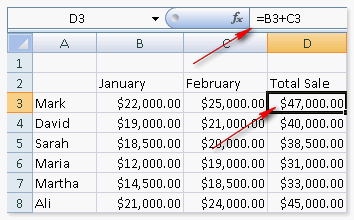
You want to write a formula to add the values in B3 and C3 cells, and display the added value in D3 cell. From which of the following symbols will you begin to write the formula?
Answer : B
A formula in Excel is an expression to calculate values. It includes values, cell references, names, functions, or operators. Using a formula in a cell produces a new value. A formula always begins with an equal sign (=). For example, to add the values in B3 and C3 cells, and display the added value in D3 cell, the following formula should be inserted in the D3 cell:
Answer options A, D, and C are incorrect. These are not valid symbols for beginning a formula.
Chapter: ADVANCED SPREADSHEETS
Objective: Functions
Question 2
Which of the following is used for extraction from one or more tables in a database that can be used as the basis of a report or as a standalone information source?
Answer : A
A query is used for extraction from one or more tables in a database that can be used as the basis of a report or as a standalone information source. It is a request for information from a database.
Answer option D is incorrect. A reference table is a set of references that an author may have cited or gained inspiration. It is an information table that is used as a quick and easy reference for things that are difficult to remember such as comparing imperial with metric measurements.
Answer option B is incorrect. A Form is a collection of one or more fields that allow the user to enter information (like text fields, text area fields, drop-down menus, radio buttons, check-boxes, etc.).
Answer option C is incorrect. PivotTable is a view of a table, which can be used to display the data of a table in the desired format. This view cannot be used to create or delete a field or modify its properties. The data can be filtered according to fields. When the PivotTable view is opened, a blank work area is displayed and the columns of the table are displayed in the Pivot Table Field List window.
Chapter: ADVANCED SPREADSHEETS
Objective: Special Tools
Question 3
Which of the following steps will you take to hide a row in a worksheet?
Answer : A
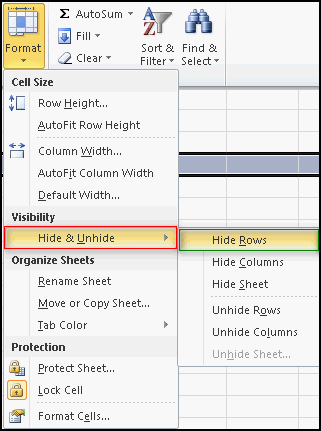
Take the following steps to hide a row in a worksheet:
Go to the Format drop down icon in the Home tab.

Select the Hide & Unhide option in the Format drop down icon and click the Hide Rows option.
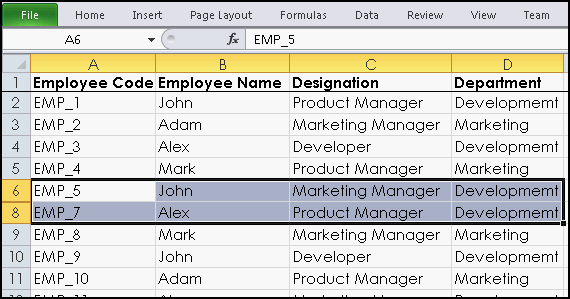
After clicking the Hide & Unhide option, it will automatically hide the selected rows.
Answer options B, C, and D are incorrect. These are not valid steps to hide a row in a worksheet.
Chapter: ADVANCED SPREADSHEETS
Objective: Editing
Question 4
You are working on an Access form named Form-A. You have opened Property Sheet to view the form's properties and make the required changes. Property Sheet consists of five tabs with a different set of properties. Which of the following tabs specifies how a value is displayed and the data source is bound to control source, input mask, validation rule, default value, and other data type?
Answer : A
Chapter: DATABASE, ADVANCED-LEVEL
Objective: Form Design
Question 5
Which of the following properties binds the object to a source from which data is to be retrieved?
Answer : A
The RecordSource property belongs to the form and report objects. This property binds the object to a source from which data is to be retrieved. This source can be a table or a query. When a form or a report is bound to a table or a query, the controls can be bound to a column of the table through the ControlSource property.
Answer option D is incorrect. The ControlSource property bounds a control to a field of a table. If a control is bound to a field by using this property, the control is known as a bound control. If the value of this property is blank, the control is known as an unbound control. If the ControlSource property contains an expression, the control is known as a calculated control.
Answer option C is incorrect. The RowSource property belongs to the combo box and list box controls. When these controls are bound to a column by the RowSource property, all the data of the column is displayed in the list box or the combo box.
Answer option B is incorrect. The TextFormat property of a control helps to change a text to rich text format. This helps to apply multiple formatting options for the text in a control. A user can change the format of the text to bold, italics, etc., The user can also change the font of the selected text and can apply other types of formatting.
Chapter: DATABASE, ADVANCED-LEVEL
Objective: Form Design
Question 6
You are typing a document and you want the date of the creation of the document to appear on top of each page. What will you do to accomplish the task?
Answer : C
Header is an area in a document where a user can put vital information such as page number, date of creation of document, time of creation of document, filename, and other information. It always appears on the top of each page.
Chapter: ADVANCED WORD PROCESSING
Objective: Prepare Outputs
Question 7
with the appropriate term.
A user can use a _________query to calculate a sum, average, count, or other type of total for data that is grouped by two types of information- one down the left side of the datasheet and one across the top.
See Below Explanation:
A crosstab query is a powerful analysis tool used to see the relationship of data between two fields. It calculates and restructures data for easier analysis. A user can use a crosstab query to calculate a sum, average, count, or other type of total for data that is grouped by two types of information- one down the left side of the datasheet and one across the top. The cell at the junction of each row and column displays the results of the query's calculation. This view is just like a spreadsheet with unique values of one field as rows, unique values of another field as columns, and the summary of another field as the cells in the matrix.
Chapter: DATABASE, ADVANCED-LEVEL
Objective: Query Design
Answer : A
A crosstab query is a powerful analysis tool used to see the relationship of data between two fields. It calculates and restructures data for easier analysis. A user can use a crosstab query to calculate a sum, average, count, or other type of total for data that is grouped by two types of information- one down the left side of the datasheet and one across the top. The cell at the junction of each row and column displays the results of the query's calculation. This view is just like a spreadsheet with unique values of one field as rows, unique values of another field as columns, and the summary of another field as the cells in the matrix.
Chapter: DATABASE, ADVANCED-LEVEL
Objective: Query Design
 All Official Question Types