Page: 1
/ 14
Total 131 questions
Fortinet NSE 6 - Network Security 7.6 Support Engineer FCSS_NST_SE-7.6 Exam Questions
Question 1
Which two protocol states indicate that traffic is bidirectional? (Choose two.)
Answer : A, B
The correct answers are A and B.
For UDP, the study guide states this directly: ''For UDP, the session state can have only two values: 00 when traffic is only one way, and 01 when traffic is two ways. For ICMP, the protocol state is always 00.''
That makes B correct and D incorrect.
For TCP, the study guide explains that the protocol state is a two-digit number, where the first digit is the server-side state and the second digit is the client-side state. It also states that the first digit is 0 when the session is not subject to any inspection, and the TCP state table shows that value 1 = ESTABLISHED
So, for a normal non-proxied/non-inspected TCP session, proto_state=01 means the TCP session is in the ESTABLISHED state. An established TCP session means the three-way handshake has completed, which requires traffic in both directions. That is why A is correct.
The study guide also says: ''proto_state=11 means that the TCP three-way handshake for both server-side and client-side is completed (ESTABLISHED).''
This confirms that TCP state value 1 represents an established state.
Why C is not selected: the study guide defines value 5 as TIME_WAIT and says: ''When a session is closed by both the sender and receiver, FortiGate keeps that session in the session table for a few seconds... This is the state value 5.''
So proto_state=05 represents a closing/closed TCP session in TIME_WAIT, not the normal bidirectional state the question is testing.
Therefore, the verified answers are A and B.
Question 2
Refer to the exhibit.
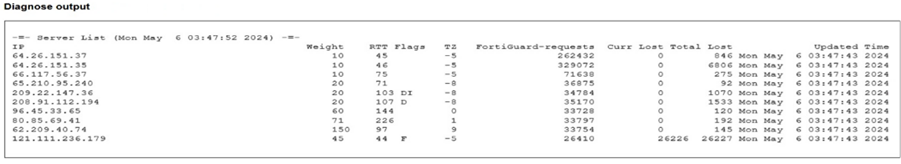
Partial output of command diagnose debug rating is shown. Which FDS server will the FortiGate algorithm choose?
Answer : C
The correct answer is C. 64.26.151.37.
The study guide explains the FortiGuard flags shown by diagnose debug rating:
D = Default
I = Initial
T = Timing
F = Failed
and specifically: ''F = The server is down''
So even though 121.111.236.179 has the lowest RTT in the exhibit, it has the F flag, meaning FortiGate considers that server failed/down, so it will not be chosen.
To determine which active server is selected, the FortiOS administration guide states:
''The server list is sorted first by weight. The server with the smallest RTT appears at the top of the list regardless of weight. ... Therefore the top position in the list is selected based on RTT while the other positions are based on weight.''
Among the valid, non-failed choices in the exhibit:
64.26.151.37 RTT 45
209.22.147.36 RTT 103
96.45.33.65 RTT 144
208.91.112.194 RTT 107
The active server with the lowest RTT is 64.26.151.37, so that is the server FortiGate will choose.
So the verified answer is: C.
Question 3
Refer to the exhibit.
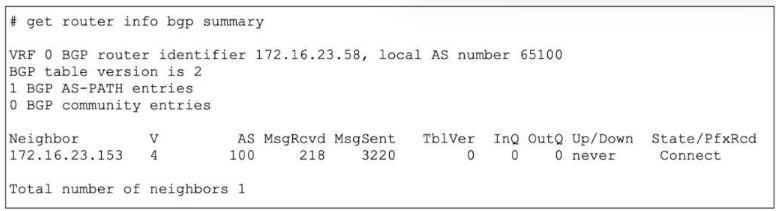
The output of a BGP debug command is shown.
Why has the local router at 172.16.23.58 been unable to establish adjacency with its only neighbor?
Answer : C
The correct answer is C.
The exhibit shows the neighbor state as Connect in the State/PfxRcd column. The study guide explains the BGP states exactly as follows:
''Connect: Waiting for a successful three-way TCP connection''
''OpenSent: Waiting for an OPEN message from the peer''
''Established: Peers have successfully exchanged OPEN and keepalive messages''
Because the router is still in Connect state, the TCP three-way handshake has not completed yet. In practical terms, the local router has sent the TCP SYN but has not successfully received the SYN/ACK needed to complete the handshake. That is why C is correct.
Why the other options are wrong:
A is wrong because the message counters alone do not prove that the neighbor is unreachable. The study guide says the State/PfxRcd field shows the BGP state when the session is not established, and here that state is specifically Connect
B is wrong because waiting for an OPEN message happens in OpenSent, not Connect
D is not the best answer for this output. The study guide ties the displayed state directly to the protocol phase: Connect means the device is still waiting for a successful TCP handshake
So the verified answer is: C.
Question 4
Refer to the exhibit.
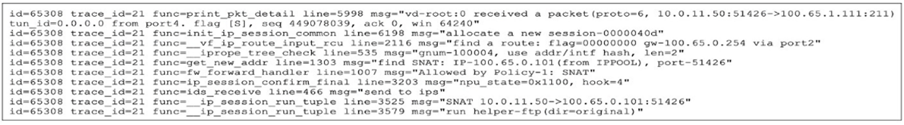
An administrator has configured a firewall policy to use proxy-based inspection mode. What could explain the messages observed in the debug flow output?
Answer : A
The correct answer is A.
The debug flow shows:
traffic is going to TCP port 211
FortiGate logs run helper-ftp(dir=original)
The study guide explains exactly what that message means:
''In this example, the run helper-ftp message indicates that the FTP session helper is being used.''
Under normal proxy-based inspection, protocol handling is controlled by Protocol Options. The FortiOS administration guide states:
''Protocol port mapping only works with proxy-based inspection.'' and ''The ports can be modified to inspect any port with flowing traffic.''
So if the policy is configured for proxy-based inspection but the debug still shows the FTP session helper on port 211, the most likely explanation is that the FTP protocol mapping in Protocol Options is broad enough to match unexpectedly, such as being mapped to Any. That would cause FortiGate to identify the traffic as FTP and invoke the helper.
Why the other options are wrong:
B is wrong because SSL deep inspection is unrelated to this debug. The traffic shown is plain TCP/211, and the key message is about the FTP helper, not SSL decryption.
C is wrong because if FTP had not been mapped to port 211, FortiGate would be less likely to treat this traffic as FTP. The observed run helper-ftp indicates FTP handling is being triggered.
D is wrong because low-memory conserve behavior would typically cause inspection bypass or blocking behavior, not specifically the run helper-ftp message. The study guide's helper example ties this message to session-helper use, not memory shortage.
So the verified answer is: A.
Question 5
Refer to the exhibit, which contains the output of diagnose vpn tunnel list.
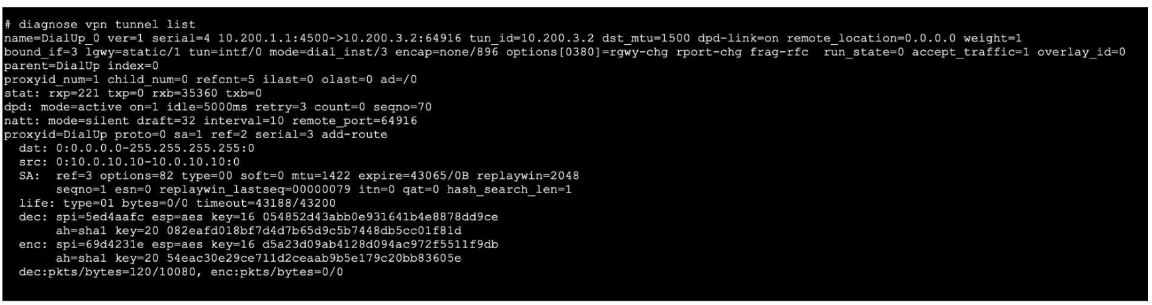
Which command will capture ESP traffic for the VPN named DialUp_0?
Answer : D
Question 6
Refer to the exhibit, which shows the output of a BGP debug command.
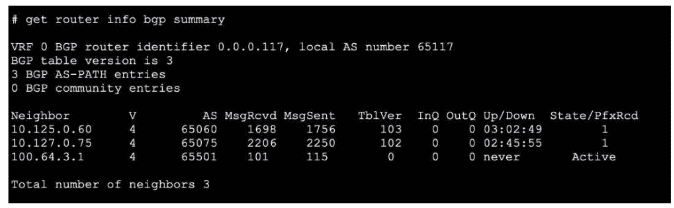
What can you conclude about the router in this scenario?
Answer : D
The BGP debug output shows session information for peers, including state details. According to official Fortinet BGP documentation, if the session state with a peer does not show 'Idle,' 'Active,' or 'Connect,' but instead shows 'Established,' 'Up,' or related counters (e.g., messages sent/received or uptime), it indicates the session is operational. In this scenario, the peer 10.127.0.75 is the only one showing a positive indication of a live, established session. Other options like neighbor-range configuration, AS mismatch, or route-maps blocking prefixes are not supported by evidence provided in a simple BGP session state debug, nor does the output show errors relating to local or remote AS issues.
The correct interpretation comes from Fortinet's BGP troubleshooting guide, which outlines how to read session status and neighbor states in debug and summary outputs.
References:
FortiOS BGP Debugging Guide: Session State Interpretation
BGP CLI Reference: Neighbor Status Fields
Question 7
Refer to the exhibit.
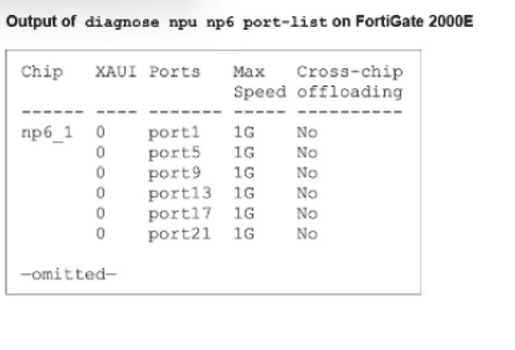
A partial output of diagnose npu up6 port-list on FortiGate 2000E is shown.
An administrator is unable to analyze traffic flowing between port1 and port17 using the diagnose sniffer command.
Which two commands allow the administrator to view the traffic? (Choose two.)
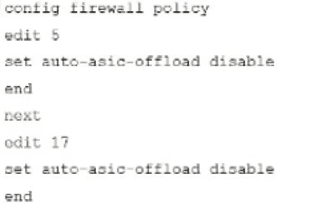
A)

B)
C)

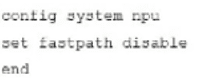
D)
Answer : B, C
The administrator cannot see traffic in the sniffer because it is being offloaded to the NPU (NP6). To view the traffic, offloading must be disabled so packets pass through the CPU.
B . config firewall policy ... set auto-asic-offload disable: This is the recommended method to troubleshoot specific traffic. By disabling ASIC offloading in the relevant firewall policies (Policies 5 and 17 in the exhibit), traffic is forced to the CPU and becomes visible to the sniffer.
C . diagnose npu np6 fastpath disable 1: This command temporarily disables the fastpath processing on the specific NP6 processor (ID 1) handling the ports. This forces all traffic handled by that NPU to the CPU, allowing the sniffer to capture it.
Incorrect Options: Option A uses invalid syntax (port-list disable is not a valid command). Option D (config system npu) is not the standard method for granular troubleshooting.