Page: 1
/ 14
Total 32 questions
Fortinet FCSS - Security Operations 7.4 Analyst FCSS_SOC_AN-7.4 Exam Questions
Question 1
Which statement describes automation stitch integration between FortiGate and FortiAnalyzer?
Answer : D
Overview of Automation Stitches: Automation stitches in Fortinet solutions enable automated responses to specific events detected within the network. This automation helps in swiftly mitigating threats without manual intervention.
FortiGate Security Profiles:
FortiGate uses security profiles to enforce policies on network traffic. These profiles can include antivirus, web filtering, intrusion prevention, and more.
When a security profile detects a violation or a specific event, it can trigger predefined actions.
Webhook Calls:
FortiGate can be configured to send webhook calls upon detecting specific security events.
A webhook is an HTTP callback triggered by an event, sending data to a specified URL. This allows FortiGate to communicate with other systems, such as FortiAnalyzer.
FortiAnalyzer Integration:
FortiAnalyzer collects logs and events from various Fortinet devices, providing centralized logging and analysis.
Upon receiving a webhook call from FortiGate, FortiAnalyzer can further analyze the event, generate reports, and take automated actions if configured to do so.
Detailed Process:
Step 1: A security profile on FortiGate triggers a violation based on the defined security policies.
Step 2: FortiGate sends a webhook call to FortiAnalyzer with details of the violation.
Step 3: FortiAnalyzer receives the webhook call and logs the event.
Step 4: Depending on the configuration, FortiAnalyzer can execute an automation stitch to respond to the event, such as sending alerts, generating reports, or triggering further actions.
Fortinet Documentation: FortiOS Automation Stitches
FortiAnalyzer Administration Guide: Details on configuring event handlers and integrating with FortiGate.
FortiGate Administration Guide: Information on security profiles and webhook configurations.
By understanding the interaction between FortiGate and FortiAnalyzer through webhook calls and automation stitches, security operations can ensure a proactive and efficient response to security events.
Question 2
Which role does a threat hunter play within a SOC?
Answer : C
Role of a Threat Hunter:
A threat hunter proactively searches for cyber threats that have evaded traditional security defenses. This role is crucial in identifying sophisticated and stealthy adversaries that bypass automated detection systems.
Key Responsibilities:
Proactive Threat Identification:
Threat hunters use advanced tools and techniques to identify hidden threats within the network. This includes analyzing anomalies, investigating unusual behaviors, and utilizing threat intelligence.
Understanding the Threat Landscape:
They need a deep understanding of the threat landscape, including common and emerging tactics, techniques, and procedures (TTPs) used by threat actors.
Advanced Analytical Skills:
Utilizing advanced analytical skills and tools, threat hunters analyze logs, network traffic, and endpoint data to uncover signs of compromise.
Distinguishing from Other Roles:
Investigate and Respond to Incidents (A):
This is typically the role of an Incident Responder who reacts to reported incidents, collects evidence, and determines the impact.
Collect Evidence and Determine Impact (B):
This is often the role of a Digital Forensics Analyst who focuses on evidence collection and impact assessment post-incident.
Monitor Network Logs (D):
This falls under the responsibilities of a SOC Analyst who monitors logs and alerts for anomalous behavior and initial detection.
Conclusion:
Threat hunters are essential in a SOC for uncovering sophisticated threats that automated systems may miss. Their proactive approach is key to enhancing the organization's security posture.
SANS Institute, 'Threat Hunting: Open Season on the Adversary'
MITRE ATT&CK Framework
CISA Threat Hunting Guide
NIST Special Publication 800-61, 'Computer Security Incident Handling Guide'
By searching for hidden threats that elude detection, threat hunters play a crucial role in maintaining the security and integrity of an organization's network.
Question 3
Refer to the exhibits.
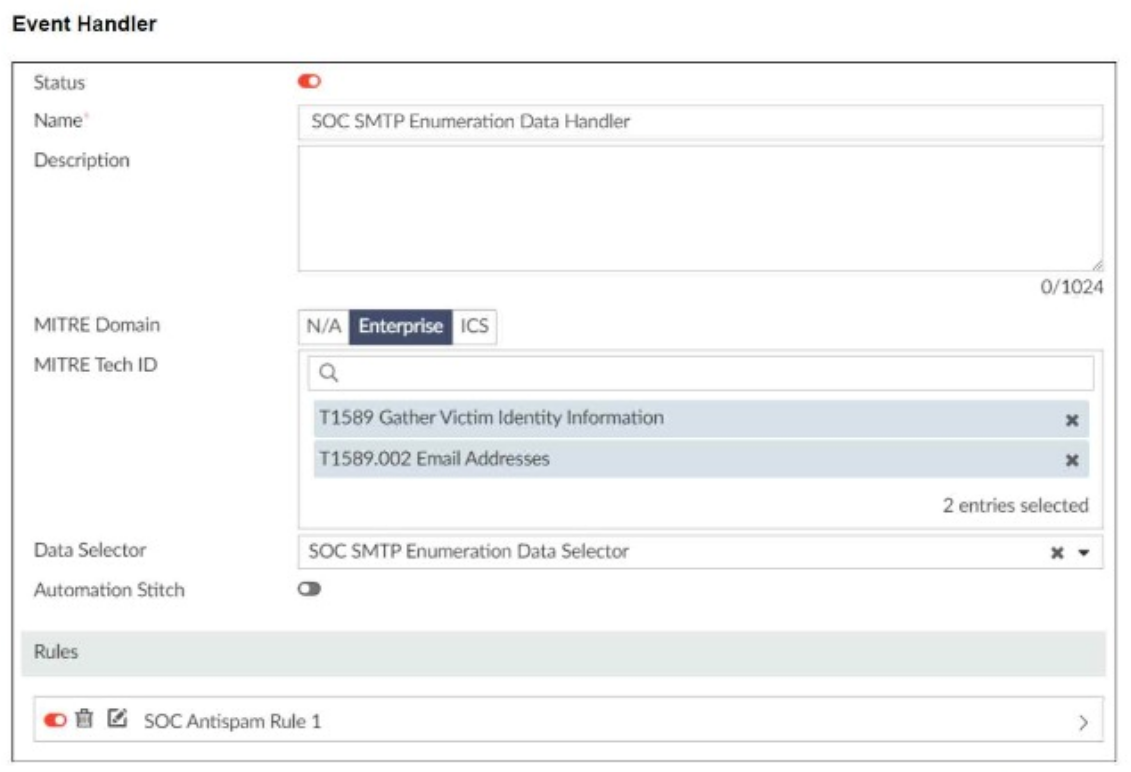
You configured a custom event handler and an associated rule to generate events whenever FortiMail detects spam emails. However, you notice that the event handler is generating events for both spam emails and clean emails.
Which change must you make in the rule so that it detects only spam emails?
Answer : A
Understanding the Custom Event Handler Configuration:
The event handler is set up to generate events based on specific log data.
The goal is to generate events specifically for spam emails detected by FortiMail.
Analyzing the Issue:
The event handler is currently generating events for both spam emails and clean emails.
This indicates that the rule's filtering criteria are not correctly distinguishing between spam and non-spam emails.
Evaluating the Options:
Option A: Selecting the 'Anti-Spam Log (spam)' in the Log Type field will ensure that only logs related to spam emails are considered. This is the most straightforward and accurate way to filter for spam emails.
Option B: Typing type==spam in the Log filter by Text field might help filter the logs, but it is not as direct and reliable as selecting the correct log type.
Option C: Disabling the rule to use the filter in the data selector to create the event does not address the issue of filtering for spam logs specifically.
Option D: Selecting 'Within a group, the log field Spam Name (snane) has 2 or more unique values' is not directly relevant to filtering spam logs and could lead to incorrect filtering criteria.
Conclusion:
The correct change to make in the rule is to select 'Anti-Spam Log (spam)' in the Log Type field. This ensures that the event handler only generates events for spam emails.
Fortinet Documentation on Event Handlers and Log Types.
Best Practices for Configuring FortiMail Anti-Spam Settings.
Question 4
Refer to the Exhibit:
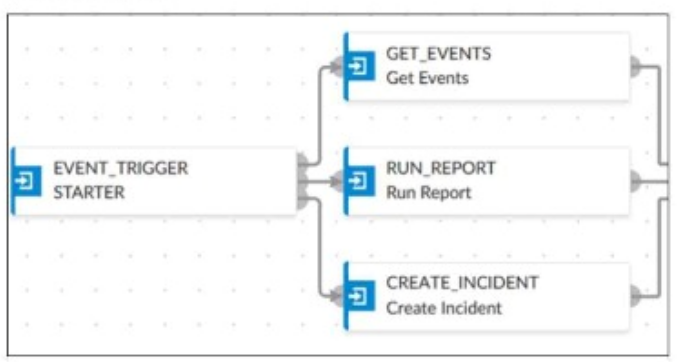
An analyst wants to create an incident and generate a report whenever FortiAnalyzer generates a malicious attachment event based on FortiSandbox analysis. The endpoint hosts are protected by FortiClient EMS integrated with FortiSandbox. All devices are logging to FortiAnalyzer.
Which connector must the analyst use in this playbook?
Answer : A
Understanding the Requirements:
The objective is to create an incident and generate a report based on malicious attachment events detected by FortiAnalyzer from FortiSandbox analysis.
The endpoint hosts are protected by FortiClient EMS, which is integrated with FortiSandbox. All logs are sent to FortiAnalyzer.
Key Components:
FortiAnalyzer: Centralized logging and analysis for Fortinet devices.
FortiSandbox: Advanced threat protection system that analyzes suspicious files and URLs.
FortiClient EMS: Endpoint management system that integrates with FortiSandbox for endpoint protection.
Playbook Analysis:
The playbook in the exhibit consists of three main actions: GET_EVENTS, RUN_REPORT, and CREATE_INCIDENT.
EVENT_TRIGGER: Starts the playbook when an event occurs.
GET_EVENTS: Fetches relevant events.
RUN_REPORT: Generates a report based on the events.
CREATE_INCIDENT: Creates an incident in the incident management system.
Selecting the Correct Connector:
The correct connector should allow fetching events related to malicious attachments analyzed by FortiSandbox and facilitate integration with FortiAnalyzer.
Connector Options:
FortiSandbox Connector:
Directly integrates with FortiSandbox to fetch analysis results and events related to malicious attachments.
Best suited for getting detailed sandbox analysis results.
Selected as it is directly related to the requirement of handling FortiSandbox analysis events.
FortiClient EMS Connector:
Used for managing endpoint security and integrating with endpoint logs.
Not directly related to fetching sandbox analysis events.
Not selected as it is not directly related to the sandbox analysis events.
FortiMail Connector:
Used for email security and handling email-related logs and events.
Not applicable for sandbox analysis events.
Not selected as it does not relate to the sandbox analysis.
Local Connector:
Handles local events within FortiAnalyzer itself.
Might not be specific enough for fetching detailed sandbox analysis results.
Not selected as it may not provide the required integration with FortiSandbox.
Implementation Steps:
Step 1: Ensure FortiSandbox is configured to send analysis results to FortiAnalyzer.
Step 2: Use the FortiSandbox connector in the playbook to fetch events related to malicious attachments.
Step 3: Configure the GET_EVENTS action to use the FortiSandbox connector.
Step 4: Set up the RUN_REPORT and CREATE_INCIDENT actions based on the fetched events.
Fortinet Documentation on FortiSandbox Integration FortiSandbox Integration Guide
Fortinet Documentation on FortiAnalyzer Event Handling FortiAnalyzer Administration Guide
By using the FortiSandbox connector, the analyst can ensure that the playbook accurately fetches events based on FortiSandbox analysis and generates the required incident and report.
Question 5
Refer to the exhibits.
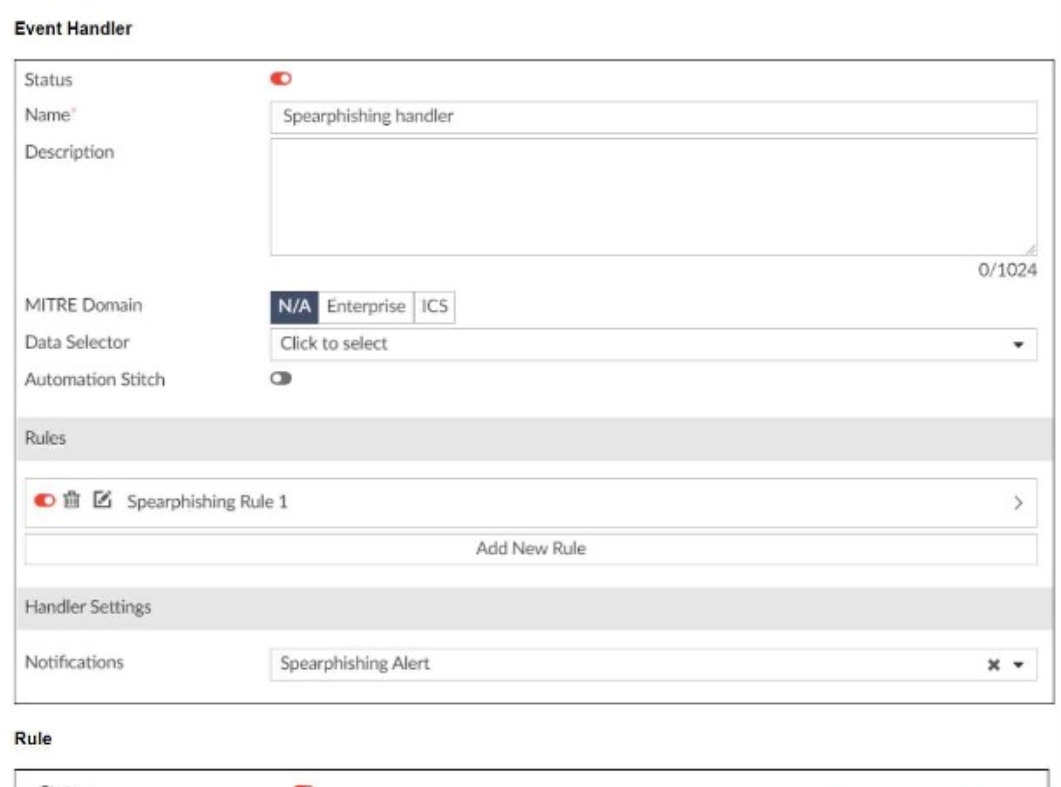
You configured a spearphishing event handler and the associated rule. However. FortiAnalyzer did not generate an event.
When you check the FortiAnalyzer log viewer, you confirm that FortiSandbox forwarded the appropriate logs, as shown in the raw log exhibit.
What configuration must you change on FortiAnalyzer in order for FortiAnalyzer to generate an event?
Answer : B
Understanding the Event Handler Configuration:
The event handler is set up to detect specific security incidents, such as spearphishing, based on logs forwarded from other Fortinet products like FortiSandbox.
An event handler includes rules that define the conditions under which an event should be triggered.
Analyzing the Current Configuration:
The current event handler is named 'Spearphishing handler' with a rule titled 'Spearphishing Rule 1'.
The log viewer shows that logs are being forwarded by FortiSandbox but no events are generated by FortiAnalyzer.
Key Components of Event Handling:
Log Type: Determines which type of logs will trigger the event handler.
Data Selector: Specifies the criteria that logs must meet to trigger an event.
Automation Stitch: Optional actions that can be triggered when an event occurs.
Notifications: Defines how alerts are communicated when an event is detected.
Issue Identification:
Since FortiSandbox logs are correctly forwarded but no event is generated, the issue likely lies in the data selector configuration or log type matching.
The data selector must be configured to include logs forwarded by FortiSandbox.
Solution:
B . Configure a FortiSandbox data selector and add it to the event handler:
By configuring a data selector specifically for FortiSandbox logs and adding it to the event handler, FortiAnalyzer can accurately identify and trigger events based on the forwarded logs.
Steps to Implement the Solution:
Step 1: Go to the Event Handler settings in FortiAnalyzer.
Step 2: Add a new data selector that includes criteria matching the logs forwarded by FortiSandbox (e.g., log subtype, malware detection details).
Step 3: Link this data selector to the existing spearphishing event handler.
Step 4: Save the configuration and test to ensure events are now being generated.
Conclusion:
The correct configuration of a FortiSandbox data selector within the event handler ensures that FortiAnalyzer can generate events based on relevant logs.
Fortinet Documentation on Event Handlers and Data Selectors FortiAnalyzer Event Handlers
Fortinet Knowledge Base for Configuring Data Selectors FortiAnalyzer Data Selectors
By configuring a FortiSandbox data selector and adding it to the event handler, FortiAnalyzer will be able to accurately generate events based on the appropriate logs.
Question 6
When does FortiAnalyzer generate an event?
Answer : C
Understanding Event Generation in FortiAnalyzer:
FortiAnalyzer generates events based on predefined rules and conditions to help in monitoring and responding to security incidents.
Analyzing the Options:
Option A: Data selectors filter logs based on specific criteria but do not generate events on their own.
Option B: Connectors facilitate integrations with other systems but do not generate events based on log matches.
Option C: Event handlers are configured with rules that define the conditions under which events are generated. When a log matches a rule in an event handler, FortiAnalyzer generates an event.
Option D: Tasks in playbooks execute actions based on predefined workflows but do not directly generate events based on log matches.
Conclusion:
FortiAnalyzer generates an event when a log matches a rule in an event handler.
Fortinet Documentation on Event Handlers and Event Generation in FortiAnalyzer.
Best Practices for Configuring Event Handlers in FortiAnalyzer.
Question 7
Refer to the exhibit,

which shows the partial output of the MITRE ATT&CK Enterprise matrix on FortiAnalyzer.
Which two statements are true? (Choose two.)
Answer : B, C
Understanding the MITRE ATT&CK Matrix:
The MITRE ATT&CK framework is a knowledge base of adversary tactics and techniques based on real-world observations.
Each tactic in the matrix represents the 'why' of an attack technique, while each technique represents 'how' an adversary achieves a tactic.
Analyzing the Provided Exhibit:
The exhibit shows part of the MITRE ATT&CK Enterprise matrix as displayed on FortiAnalyzer.
The focus is on technique T1071 (Application Layer Protocol), which has subtechniques labeled T1071.001, T1071.002, T1071.003, and T1071.004.
Each subtechnique specifies a different type of application layer protocol used for Command and Control (C2):
T1071.001 Web Protocols
T1071.002 File Transfer Protocols
T1071.003 Mail Protocols
T1071.004 DNS
Identifying Key Points:
Subtechniques under T1071: There are four subtechniques listed under the primary technique T1071, confirming that statement B is true.
Event Handlers for T1071: FortiAnalyzer includes event handlers for monitoring various tactics and techniques. The presence of event handlers for tactic T1071 suggests active monitoring and alerting for these specific subtechniques, confirming that statement C is true.
Misconceptions Clarified:
Statement A (four techniques under tactic T1071) is incorrect because T1071 is a single technique with four subtechniques.
Statement D (15 events associated with the tactic) is misleading. The number 15 refers to the techniques under the Application Layer Protocol, not directly related to the number of events.
Conclusion:
The accurate interpretation of the exhibit confirms that there are four subtechniques under technique T1071 and that there are event handlers covering tactic T1071.
MITRE ATT&CK Framework documentation.
FortiAnalyzer Event Handling and MITRE ATT&CK Integration guides.