Page: 1
/ 14
Total 54 questions
Fortinet NSE 7 - Public Cloud Security 7.6.4 Architect NSE7_CDS_AR-7.6 Exam Questions
Question 1
Your monitoring team reports performance issues with a web application hosted in Azure. You suspect that the bottleneck might be due to unexpected inbound traffic spikes.
Which method should you use to identify and analyze the traffic pattern?
Answer : A
According to the FortiOS 7.6 Azure Administration Guide and the Fortinet 7.4 Public Cloud Security documentation regarding monitoring and troubleshooting in Microsoft Azure, administrators must utilize native diagnostic tools to gain visibility into network traffic patterns:
NSG Flow Logs (Option D): Network Security Group (NSG) flow logs are a feature of Azure Network Watcher that allows you to record information about IP traffic flowing through an NSG. These logs capture critical 5-tuple information (source/destination IP, port, and protocol) and whether the traffic was allowed or denied by specific security rules.
Traffic Pattern Analysis with Azure Monitor: To effectively analyze the 'pattern' of a traffic spike, these logs are typically sent to a Log Analytics workspace within Azure Monitor. By using Traffic Analytics, the raw flow data is processed into rich visualizations and searchable datasets. This allows administrators to run Kusto Query Language (KQL) queries to identify 'top talkers,' visualize traffic spikes over time, and correlate the timing of these spikes with application performance degradation.
Identifying Bottlenecks: This method is preferred for identifying bottlenecks because it provides a granular view of every packet entering or leaving the subnets where the FortiGate-VM or application servers are hosted, revealing the exact nature of the inbound volume.
Why other options are incorrect:
Option A: While Azure Firewall provides logging, it is an additional security layer that may not be deployed in all environments. NSG Flow Logs are the primary and more ubiquitous method for monitoring all subnet-level traffic regardless of firewall placement.
Option B: DDoS Protection is a preventative measure; it does not provide the historical 'identification and analysis' of traffic patterns required to diagnose a past performance bottleneck.
Option C: Azure Traffic Manager is a DNS-based load balancer. While it provides high-level metrics, it does not have visibility into the actual flow-level traffic data needed for a detailed pattern analysis of application bottlenecks.
Question 2
How does an administrator secure container environments in Amazon AWS from newly emerged security threats? (Choose one answer)
Answer : A
Comprehensive and Detailed Explanation From FortiOS 7.6, FortiWeb 7.4 Exact Extract study guide:
According to the FortiOS 7.6 Docker Administration Guide and the Public Cloud Security study materials, container security is addressed through granular visibility into container-specific protocols.
Application Control for Containers (Option A): FortiOS includes a dedicated set of application control signatures specifically for Docker traffic. These signatures allow the FortiGate-VM to identify and control specific actions within a container environment, such as:
Docker_Pull.Blob / Docker_Pull.Manifest: Identifying when a container image is being pulled from a registry.
Docker_Push.Blob / Docker_Push.Manifest: Monitoring when images are uploaded to a registry.
Enforcing Security Policies: By using these Docker-related signatures, an administrator can create firewall policies that only allow container pulls from known clean, private registries while blocking traffic from unauthorized or public registries that may contain vulnerable or malicious images.5
Defense-in-Depth: While traditional network-related signatures (Option C) or AWS-specific infrastructure signatures (Option B) protect the underlying network and cloud services, they do not provide the necessary visibility into the Docker API calls and manifest transfers required to secure the container lifecycle itself. FortiGate further enhances this by scanning the actual payload of these transfers using the Intrusion Prevention Service (IPS) and Advanced Malware Protection (AMP).
Question 3
In an SD-WAN TGW Connect topology, which three initial steps are mandatory when routing traffic from a spoke VPC to a security VPC through a Transit Gateway? (Choose three.)
Answer : A, D, E
Comprehensive and Detailed Explanation From FortiOS 7.6, FortiWeb 7.4 Exact Extract study guide:
In an AWS SD-WAN Transit Gateway (TGW) Connect topology, traffic flow must be meticulously orchestrated through VPC route tables to ensure that the FortiGate-VM (Security VPC) can inspect traffic transitioning between spokes.
Spoke to TGW Redirection (Option E): For traffic to leave a Spoke VPC and reach the inspection hub, the Spoke VPC internal routing table must be configured to send all non-local traffic (0.0.0.0/0) to the Transit Gateway (TGW). This is the first step in the traffic chain.
TGW to FortiGate Redirection (Option A): Once the traffic arrives at the TGW and is forwarded to the Security VPC via a TGW attachment, it lands in the TGW subnet (or attachment subnet). To ensure this traffic is inspected, the Security VPC TGW subnet routing table must point the default route (0.0.0.0/0) to the FortiGate's internal network interface (ENI).
FortiGate Return/Egress Path (Option D): After the FortiGate processes the packet, it must be sent back to the TGW to reach its final destination in a different spoke or to exit via a different gateway. Therefore, the Security VPC FortiGate internal subnet routing table (the subnet where the FortiGate's internal leg resides) must have a default route (0.0.0.0/0) pointing back to the TGW.
Why other options are incorrect:
Option B: If the Security VPC TGW subnet routing table points to the TGW as the next hop, it creates a routing loop where traffic arrives from the TGW and is immediately sent back without being inspected by the FortiGate.
Option C: Pointing all traffic to an Internet Gateway (IGW) would bypass the Transit Gateway entirely and send traffic to the public internet rather than through the internal security fabric.
Question 4
An administrator implements FortiWeb ingress controller to protect containerized web applications in an AWS Elastic Kubernetes Service (EKS) cluster.
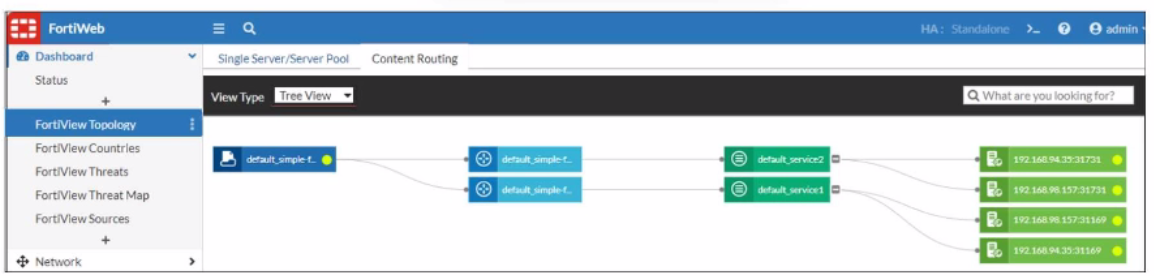
What can you conclude about the topology shown in FortiView?
Answer : A
Question 5
Refer to the exhibit.
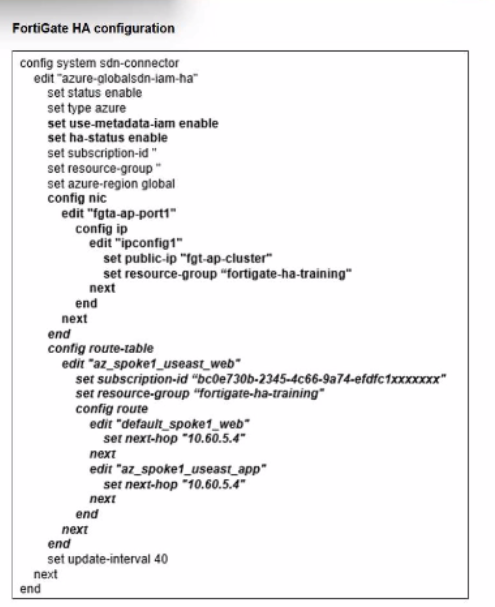
You deployed a FortiGate HA active-passive cluster in Microsoft Azure.
Which two statements regarding this particular deployment are true? (Choose two.)
Answer : B, D
Question 6
Refer to the exhibit.
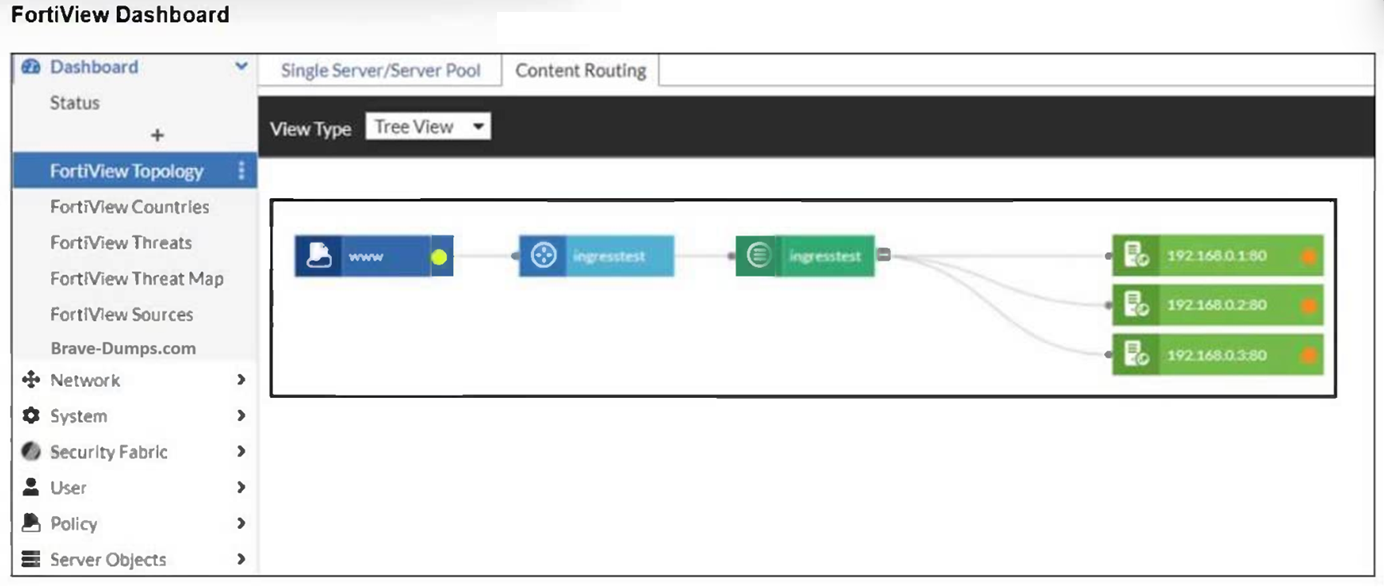
An administrator installed a FortiWeb ingress controller to protect a containerized web application. What is the reason for the status shown in FortiView? (Choose one answer)
Answer : B
Comprehensive and Detailed Explanation From FortiOS 7.6, FortiWeb 7.4 Exact Extract study guide:
According to the FortiWeb 7.4 Administration Guide and the FortiWeb Ingress Controller Installation Guide, the status of backend servers in the FortiView Topology dashboard is a direct reflection of the health check results.
Interpreting the Status Icon (Orange): In the FortiView Topology view, a green circle indicates that the server is up and responding to health checks, while an orange circle indicates that the server is not running or is unreachable.
Connectivity and Routing (Option B): For the FortiWeb ingress controller to accurately monitor and protect a containerized application, it must have a valid network path to the Kubernetes (K8s) worker nodes. If the FortiWeb VM is missing a route to the specific subnet where the K8s nodes reside, the health check packets will fail to reach their destination. As a result, FortiWeb identifies the backend servers (192.168.0.1, 192.168.0.2, and 192.168.0.3) as 'Down,' leading to the orange status shown in the exhibit.
Health Check Failures: When the status is orange, it implies that the Server Health Check (configured in the server pool) is detecting that the web servers are not responsive to connections. While this could be caused by an application-level failure, in a fresh cloud deployment of an ingress controller, the most common underlying cause is a network routing misconfiguration preventing the FortiWeb appliance from reaching the node IPs.12
Why other options are incorrect:34
Option A: If the SDN connector were not authenticated correctly, FortiWeb would likely fail to discover the containerized resources entirely, rather than discovering them and repor5ting them as 'Down'.6
Option C: While wron7g IP addresses would cause a failure, the Ingress Controller's job is to dynamically sync these addresses from the K8s API; a manual configuration error in a manifest file regarding IP addresses is less likely in an automated ingress environment.
Option D: The load balancing algorithm (Round Robin, Least Connections, etc.) affects how traffic is distributed, but it does not influence the up/down health status of the individual backend servers.
Question 7
Refer to the exhibit.
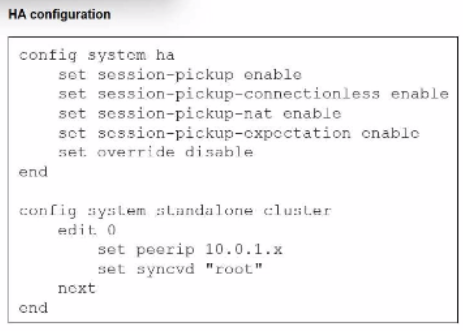
You deployed an HA active-active load balance sandwich with two FortiGate VMs in Microsoft Azure.
After the deployment, you prefer to use FGSP to synchronize sessions, and allow asymmetric return traffic. In the environment, FortiGate port 1 and port 2 are facing external and internal load balancers respectively.
What IP address must you use in the peerip configuration?
Answer : D