Page: 1
/ 14
Total 55 questions
IBM SPSS Statistics Level 1 v2 C2090-011 Exam Questions
Question 1
A paired samples t4est is different from an independent t-test because it:
Answer : A
Question 2
As of PASW Statistics 17, options for exporting tables to Excel files include which of the following? (Choose all that apply.)
Answer : A, B, C, D
Question 3
In the output of the CROSSTABS procedure, large residuals indicate agreement between the data and the null hypothesis of independence.
Answer : B
Question 4
What statistical test should be used to assess whether the percentage differences observed in a crosstabs table could have occurred by chance?
Answer : D
Question 5
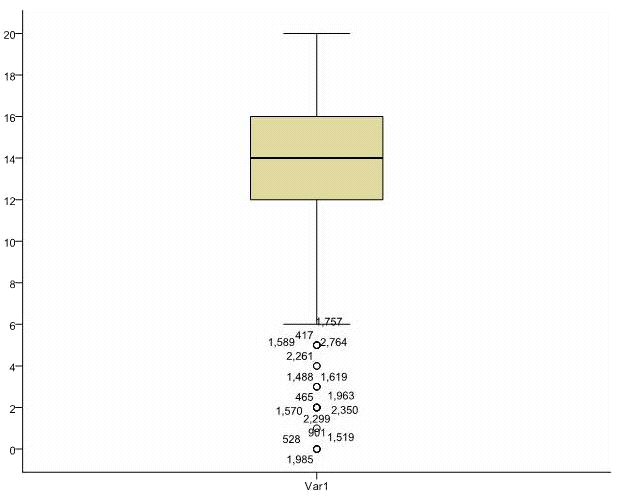
Which statement is true about this box plot?
Answer : D
Question 6
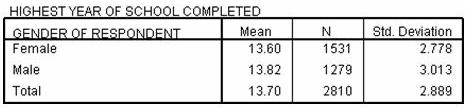
Consider the table below. Which IBM SPSS Statistics dialog was used to generate it?
Answer : B
Question 7
For a variable salary we have the statistics as shown in the figure below.
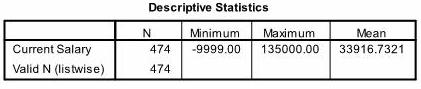
The reported Mean is incorrect because a value, -9999, is included in its calculation. How can this situation be fixed?
Answer : C
 All Official Question Types