Page: 1
/ 14
Total 152 questions
IIBA Certification in Business Data Analytics CBDA IIBA - CBDA Exam Questions
Question 1
With the recent departure of two of its employees, an IT helpdesk team is now understaffed and finding it difficult to keep up with the current workload. The number of tickets being received has increased as well as the number of days to resolve the tickets. The IT manager has set up a meeting with the IT director to request funding for two new helpdesk agents. To prepare for the
meeting, the manager is interested in showing the tickets processed against ticket volume over the past year. What type of chart should the manager use to effectively show the change in processing rate over time?
Answer : C
A line chart is the type of chart that the manager should use to effectively show the change in processing rate over time, because it is a technique that displays data as a series of points connected by straight lines. A line chart can help the manager visualize the trends and patterns in the ticket volume and processing rate over the past year, and highlight the widening gap between them. A line chart can also show the seasonal variations and fluctuations in the data, and compare the performance of different categories or groups. Options A, B, and D are not suitable for showing the change in processing rate over time, because they are techniques that display data as proportions (A), comparisons (B), or accumulations (D) of different categories or groups at a single point in time or over a fixed period. Reference:
* Business Analysis Certification in Data Analytics, CBDA | IIBA, CBDA Competencies, Domain 4: Interpret and Report Results
* Understanding the Guide to Business Data Analytics, page 18
* 16 Best Types of Charts and Graphs for Data Visualization [+ Guide]
Question 2
The analytics team has been asked to determine if the organization should launch their highest revenue generating product into the North American market. To date, this has only been available in Eastern Europe. To answer this, the team formulates several research questions, including:
Answer : D
One of the steps in identifying the research questions for business data analytics is to assess the feasibility and desirability of the proposed solution or change1. This involves understanding the needs, preferences, and satisfaction of the existing and potential customers. Therefore, asking whether the existing customers really like the product is a relevant research question for the analytics team. Reference: 1: Guide to Business Data Analytics, IIBA, 2020, p. 22.
Question 3
The outcome from an analytics initiative has resulted in key stakeholders wanting to move forward with a project to redesign the company's website. The business analyst has called a meeting to work on drafting a plan to assess the level of effort required to complete this work. Many of the invited participants redesigned the website before and were invited so they could provide estimates using their knowledge and experience from the past. The business analyst is using which method to estimate this work?
Answer : D
The business analyst is using the rough order of magnitude method to estimate this work. This method is based on expert opinion or experience from past projects, and it provides a quick and approximate estimate of the cost, time, or effort required for a project or a task. This method is useful when there is limited information or data available, or when a high-level estimate is needed for planning or budgeting purposes. However, this method also has a high degree of uncertainty and variability, and it should be refined as more details become available12 Reference: 1: Project Estimation Techniques Business Analysts Should Know About 2: Estimation techniques for business analysts -- The Functional BA
Question 4
A grocery store chain has requested help in determining how customer preferences are changing with regards to home delivery. An analytics team has completed researching the number of online orders received requesting home delivery versus in-store pickup. The business analyst has selected a model to enable a quick comparison between curbside pick-up, in-store pickup, and home delivery for the last 3 years. Which model has the business analyst chosen?
Answer : D
Question 5
An analytics team employed at a leading credit card company is utilizing data analytics to identify unusual credit card purchases.
They have created the following visual. How many extreme outliers exists in this dataset?
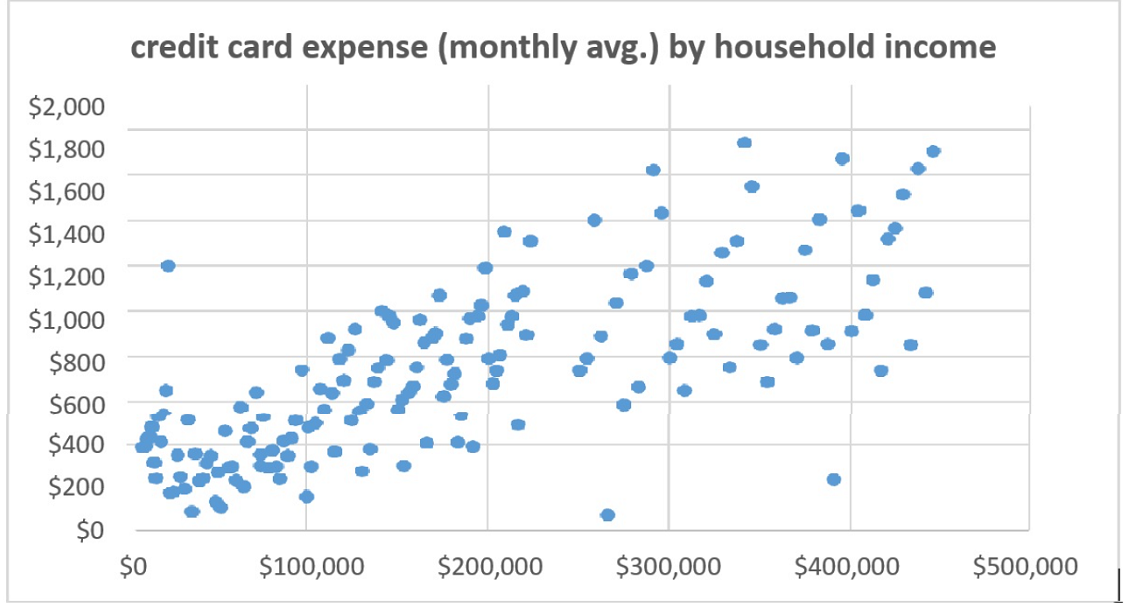
Answer : C
According to the Business Data Analytics (IIBA- CBDA) principles, extreme outliers in a dataset can be identified visually on a scatter plot as points that are distinctly separate from the bulk of the data. In this visual, there are three points that are significantly higher on the y-axis (credit card expense) relative to their position on the x-axis (household income), indicating unusual credit card purchases. Reference: The identification and interpretation of outliers is a standard practice in data analytics and is covered under the Business Data Analytics (IIBA- CBDA) learning resources.
Question 6
The CustomerOrder entity will include information on all customer orders. Applying database normalization rules, which set of attributes will need to be normalized to avoid redundancies?
* Customerld
* CustomerPhone
* Orderld
* OrderDate
* ProductName
* ProductQuantity
* OrderTotal
Answer : B
Database normalization is the process of organizing the data in a database to reduce redundancy and improve integrity, consistency, and performance1.Database normalization rules are based on the concept of normal forms, which are levels of database design that meet certain criteria2.One of the most common normal forms is the third normal form (3NF), which states that a table should not have any transitive dependencies, meaning that a non-key attribute should not depend on another non-key attribute3. In the CustomerOrder entity, the set of attributes that will need to be normalized to avoid redundancies are ProductName and ProductQuantity, as they are non-key attributes that depend on another non-key attribute, Orderld. This means that the same product information may be repeated for different orders, which could lead to data inconsistency, duplication, or update anomalies. To normalize this set of attributes, a separate table should be created for the OrderDetails entity, which would have Orderld, ProductName, and ProductQuantity as its attributes, and Orderld and ProductName as its composite primary key.
The other sets of attributes do not need to be normalized to avoid redundancies, as they do not violate the 3NF. CustomerPhone and ProductName are non-key attributes that depend on the primary key, Customerld and Orderld respectively, which is allowed by the 3NF. Orderld and ProductName are part of the composite primary key of the OrderDetails entity, which is also allowed by the 3NF.Customerld and OrderDate are both primary keys of the Customer and Order entities respectively, which are also allowed by the 3NF.
Question 7
An analyst is tasked with helping the sales team make better use of its data to support informed business decision making. The analyst creates the following research question 'How can shipping costs be lowered in the northeast to remain competitive?'. This question:
Answer : C