Page: 1
/ 14
Total 155 questions
Microsoft Analyzing and Visualizing Data with Microsoft Power BI 70-778 Exam Questions
Question 1
You have the following two queries in Power BI Desktop:
A query named Query1 that retrieves a table named SMB_Customers from a Microsoft SQL Server database
A query named Query2 that retrieves a table named Enterprise_Customers from an Oracle database
Both tables have the same columns.
You need to combine the data from SMB_Customers and Enterprise_Customers.
Which command should you use?
Answer : D
References:
http://radacad.com/append-vs-merge-in-power-bi-and-power-query
Question 2
Note: This question is part of a series of questions that use the same scenario. For your convenience, the scenario is repeated in each question. Each question presents a different goal and answer choices, but the text of the scenario is the same in each question in this series.
You have a Microsoft SQL Server database that contains the following tables.
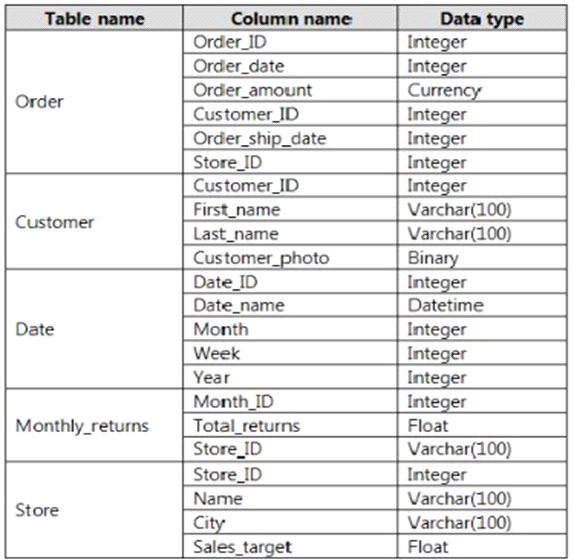
The following columns contain date information:
- Date[Month] in the mmyyyy format
- Date[Date_ID] in the ddmmyyyy format
- Date[Date_name] in the mm/dd/yyyy format
- Monthly_returns[Month_ID] in the mmyyyy format
The Order table contains more than one million rows.
The Store table has a relationship to the Monthly_returns table on the Store_ID column. This is the only relationship between the tables.
You plan to use Power BI Desktop to create an analytics solution for the data.
You need to create a relationship between the Order table and the Store table on the Store_ID column.
What should you do before you create the relationship?
Answer : C
Question 3
Note: This question is part of a series of questions that use the same scenario. For your convenience, the scenario is repeated in each question. Each question presents a different goal and answer choices, but the text of the scenario is the same in each question in this series.
Start of repeated scenario
You have a Microsoft SQL Server database that contains the following tables.
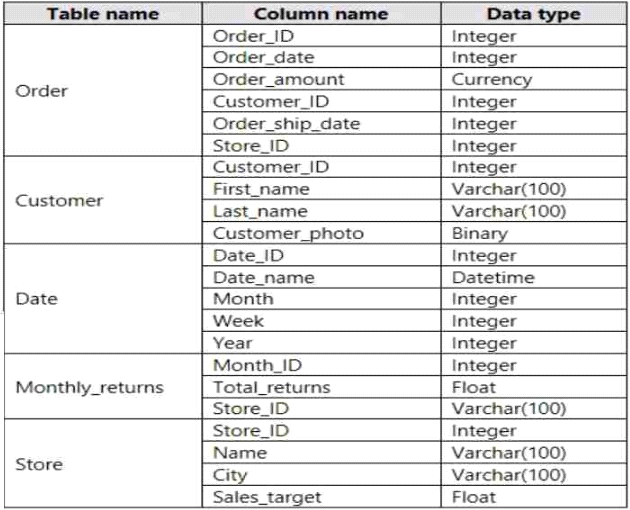
The following columns contain date information:
* Date[Month] in the mmyyyy format
* Date[Date_ID] in the ddmmyyyy format
* Date[Date_name] in the mm/dd/yyyy format
* Monthly_returns[Month_ID] in the mmyyyy format
The Order table contains more than one million rows.
The Store table has a relationship to the Monthly_returns table on the StoreJD column. This is the only relationship between the tables.
You plan to use Power Bl Desktop to create an analytics solution for the data.
End of repeated scenario.
You are modeling the data in Power Bl.
You need to import only a sample of the data from the Order table.
What are two possible ways to achieve the goal? Each correct answer presents a complete solution. NOTE: Each correct selection is worth one point.
Answer : C
Question 4
In the Power BI service, you create an app workplace that contains several dashboards.
You need to provide a user named user1@contoso.com with the ability to edit and publish dashboards.
What should you do?
Answer : C
Question 5
Note: This question is a part of a series of questions that present the same scenario. Each question in the series contains a unique solution that might meet the stated goals. Some question sets might have more than one correct solution, while others might not have a correct solution.
After you answer a question in this section, you will NOT be able to return to it. As a result, these questions will not appear in the review screen.
Your company has 1,000 users in a Microsoft Office 365 subscription.
A Power BI administrator named Admin1 creates 20 dashboards and shares them with 50 users.
You discover that a use name User1 can access all the dashboards.
You need to prevent User1 from accessing all the dashboards.
Solution: From the properties of each dashboard, you modify the Share settings.
Does this meet the goal?
Answer : B
References:
https://docs.microsoft.com/en-us/power-bi/service-admin-administering-power-bi-in-your-organization#how-do-i-remove-power-bi-for-users-that-already-signed-up
Question 6
You create a report in the Power BI service.
You plan to provide external users with access to the report in the blog post will be updated as the data is refreshed.
What should you do in the Power BI service?
Answer : C
References:
https://docs.microsoft.com/en-us/power-bi/service-publish-to-web
Question 7
You have a service published to a website.
When you connect to the website, you receive the following data.
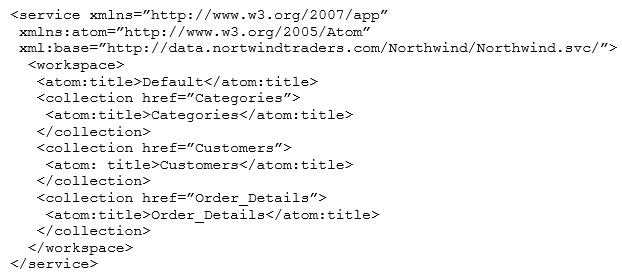
You need to create a query that retrieves the Categories data and the Customers data.
Which type of source should you use?
Answer : D