Page: 1
/ 14
Total 117 questions
Microsoft Analyzing and Visualizing Data with Microsoft Excel 70-779 Exam Questions
Question 1
Note: This question is part of a series of questions that present the same scenario. Each question in the series contains a unique solution that might meet the stated goals. Some question sets might have more than one correct solution, while others might not have a correct solution.
After you answer a question in this section, you will NOT be able to return to it. As a result, these questions will not appear in the review screen.
You have a Power Pivot model that contains the following tables.
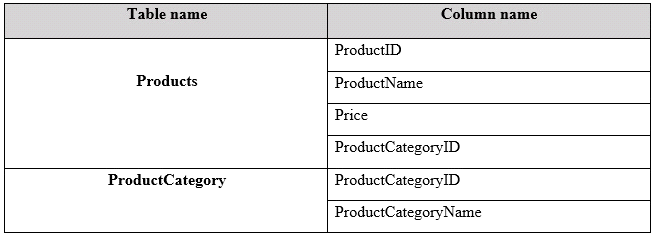
There is a relationship between Products and ProductCategory.
You need to create a hierarchy in Products that contains ProductCategoryName and ProductName.
Solution: You create a calculated column that uses the RELATED DAX function
Does this meet the goal?
Answer : A
References:
https://www.mssqltips.com/sqlservertip/2900/creating-hierarchies-in-powerpivot-for-excel/
https://msdn.microsoft.com/en-us/library/ee634202.aspx
Question 2
You have the following data sample.
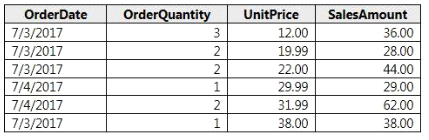
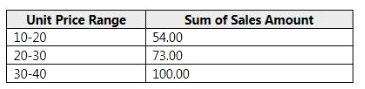
You need to create a PivotTable that presents the data as shown in the following table.
Answer : A
https://exceljet.net/lessons/how-to-group-a-pivot-table-by-age-range
Question 3
You add two tables named Date and Invoices to a data model, Invoices contains a column named InvoiceDate that has a Data Type of Date, Date contains a column named DateID that has a Data Type of which Number. DateID is in the format of YYYYMMDD.
You need to create a relationship between Date and Invoices.
What should you do first?
Answer : C
https://support.office.com/en-us/article/data-types-in-data-models-e2388f62-6122-4e2b-bcad-053e3da9ba90?ui=en-USHYPERLINK 'https://support.office.com/en-us/article/data-types-in-data-models-e2388f62-6122-4e2b-bcad-053e3da9ba90?ui=en-US&rs=en-US&ad=US#__toc319430522'&HYPERLINK 'https://support.office.com/en-us/article/data-types-in-data-models-e2388f62-6122-4e2b-bcad-053e3da9ba90?ui=en-US&rs=en-US&ad=US#__toc319430522'rs=en-USHYPERLINK 'https://support.office.com/en-us/article/data-types-in-data-models-e2388f62-6122-4e2b-bcad-053e3da9ba90?ui=en-US&rs=en-US&ad=US#__toc319430522'&HYPERLINK 'https://support.office.com/en-us/article/data-types-in-data-models-e2388f62-6122-4e2b-bcad-053e3da9ba90?ui=en-US&rs=en-US&ad=US#__toc319430522'ad=US#__toc319430522
Question 4
You create an Excel workbook named SalesResults.xlsx. You create a workbook query that connects to a Microsoft SQL Server Database and loads data to the data model. You create a PivotTable and PivotChart.
You plane to share SalesResults.slsx to several users outside of your organization.
You need to ensure that the users can see the PivotTable and the PivotChart when they open the file. The data in the model must be removed.
What should you do?
Answer : A
References: https://support.office.com/en-us/article/data-source-settings-power-query-9f24a631-f7eb-4729-88dd-6a4921380ca9
Question 5
You create a PivotTable and a Pivot Chart as shown in the following exhibit.
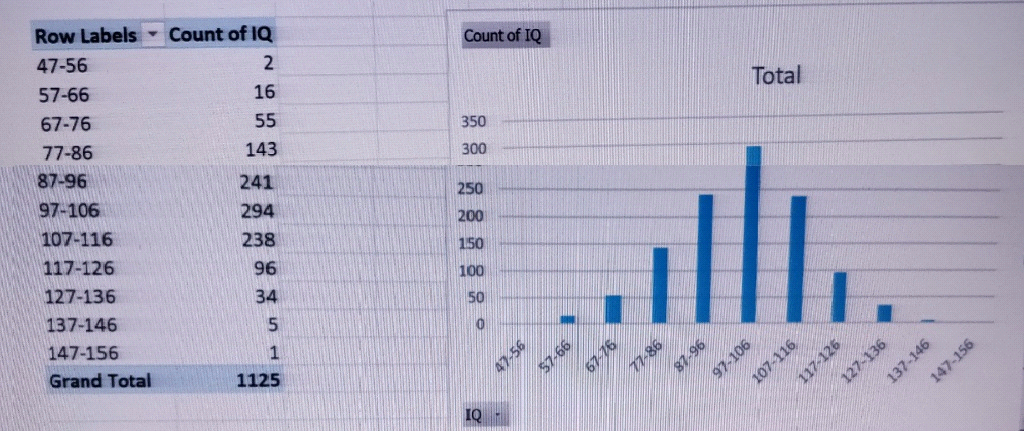
You need to decrease the number of columns in the PivotChart to six.
What should you do?
Answer : B
Question 6
You have a workbook query that loads the following table
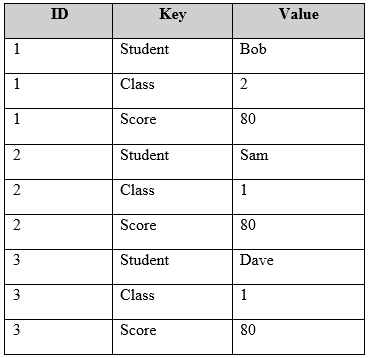
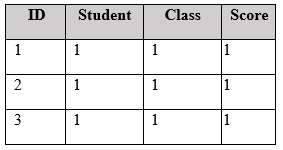
You pivot the table on the Key column by using Value as the values column, and you receive the results shown in the following table.
You need to ensure that the data appears as shown in the following table.
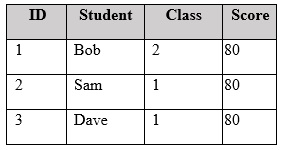
What should you do?
Answer : B
References: https://support.office.com/en-us/article/unpivot-columns-power-query-0f7bad4b-9ea1-49c1-9d95-f588221c7098
Question 7
You have a table in Power Pivot model that is loaded from a Microsoft SQL Server database.
The source table has four columns named ID, Price, Quantity, and Total. Total is derived by multiplying Price and Quantity. ID is a unique row identifier.
You need to minimize the amount of memory used to load the mode. The solution must ensure that you can create visualizations based on Price, Quantity, and Total.
What should you do?
Answer : A
References: https://support.office.com/en-us/article/create-a-memory-efficient-data-model-using-excel-and-the-power-pivot-add-in-951c73a9-21c4-46ab-9f5e-14a2833b6a70#__toc373850959