Page: 1
/ 14
Total 464 questions
Microsoft Power BI Data Analyst PL-300 Exam Questions
Question 1
You have a report that contains four pages. Each page contains slicers for the same four fields. Users report that when they select values on a slicer on one page, the visuals are not updated on all the pages. You need to recommend a solution to ensure that users can select a value once to filter the results on all the pages. What are two possible recommendations to achieve this goal? Each correct answer presents a complete solution. NOTE: Each correct selection is worth one point.
Answer : A, E
Add a report-level filter to filter an entire report.
The visuals on the active page, and on all pages in the report, change to reflect the new filter.
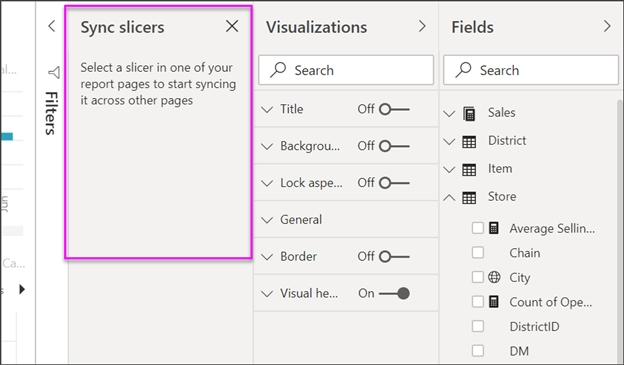
You can sync a slicer and use it on any or all pages in a report.
1. On the Power BI Desktop View menu, select Sync slicers.
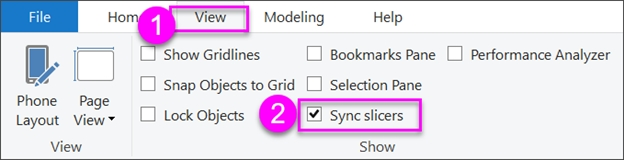
The Sync slicers pane appears between the Filters and Visualizations panes.
https://docs.microsoft.com/en-us/power-bi/create-reports/power-bi-report-add-filter
https://docs.microsoft.com/en-us/power-bi/visuals/power-bi-visualization-slicers
Question 2
You have a Microsoft Power BI data model that contains three tables named Orders, Date, and City. There is a one-to-many relationship between Date and Orders and between City and Orders.
The model contains two row-level security (RLS) roles named Role1 and Role2. Role1 contains the following filter.
City[State Province] = "Kentucky"
Role2 contains the following filter.
Date[Calendar Year] = 2020
If a user is a member of both Role1 and Role2, what data will they see in a report that uses the model?
Answer : B
When a report user is assigned to multiple roles, RLS filters become additive. It means report users can see table rows that represent the union of those filters.
https://docs.microsoft.com/en-us/power-bi/guidance/rls-guidance
Question 3
You need to create a Power BI theme that will be used in multiple reports. The theme will include corporate branding for font size, color, and bar chart formatting.
What should you do?
Answer : C
Question 4
You have a CSV file that contains user complaints. The file contains a column named Logged logged contains the date and time each complaint occurred. The data in Logged is m the following format: 2018-12-31 at 08:59.
You need to be able to analyze the complaints by the logged date and use a built-in date hierarchy.
What should you do?
Answer : A
Question 5
You create a report by using Microsoft Power BI Desktop.
The report uses data from a Microsoft SQL Server Analysis Services (SSAS) cube located on your company's internal network.
You plan to publish the report to the Power BI Service.
What should you implement ta ensure that users who consume the report from the Power BI Service have the most up-to-date data from the cube?
Answer : D
When you've created dynamic reports in Power BI Desktop, you can share them by publishing to your Power BI site. When you publish a Power BI Desktop file with a live connection to a tabular model to your Power BI site, an on-premises data gateway must be installed and configured by an administrator.
Question 6
Which type of dimension is represented by Dim Address?
Answer : A
Question 7
You have the following table named Location.
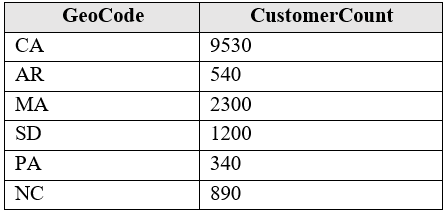
The GeoCode column represents the country where each customer is located.
You create a map visualization as shown in the exhibit. (Click the Exhibit tab.)
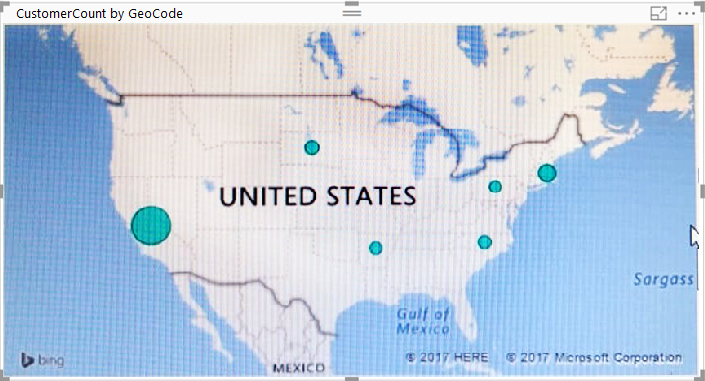
You need to ensure that the map displays the country locations.
What should you do?
Answer : B
https://docs.microsoft.com/en-us/power-bi/visuals/power-bi-map-tips-and-tricks