Page: 1
/ 14
Total 464 questions
Microsoft Power BI Data Analyst PL-300 Exam Questions
Question 1
You have a Power Bi model mat contains a table named Date. The Date table contains the fallowing columns:
* Date
* Fiscal year
* Fiscal Quartet
* Month Name
* Calendar Year
* Week Number
* Month Number
* Calendar Quarter
You need to create a calculated table based on the Date table. The calculated tab*e must contain only unique combinations of values for Calendar Year. Calendar Quarter and Calendar Month. Which DAX function should you include in the table deflation?
Answer : C
Question 2
In the Power BI service, you create an app workplace that contains several dashboards.
You need to provide a user named user1@contoso.com with the ability to edit and publish dashboards.
What should you do?
Answer : C
Question 3
You publish a report to a workspace named Customer Services. The report identifies customers that have potential data quality issues that must be investigated by the customer services department of your company.
You need to ensure that customer service managers can create task lists in Microsoft Excel based on the data.
Which report setting should you configure?
Answer : E
https://powerbi.microsoft.com/en-us/blog/announcing-persistent-filters-in-the-service/
Question 4
A manager can represent only a single country.
You need to use row-level security (RLS) to meet the following requirements:
The managers must only see the data of their respective country.
The number of RLS roles must be minimized.
Which two actions should you perform? Each correct answer presents a complete solution.
NOTE: Each correct selection is worth one point.
Answer : A, C
In Power BI Service the username and userprincipalname both return the email address, it's only in Power BI Desktop that username is domain/username rather than the email address. So I agree that userprincipalname is better generally as you always get the same value, the answer is correct and you can use username as your RLS since the role will be applied in the Service. See https://community.powerbi.com/t5/Community-Blog/USERNAME-v-s-USERPRINCIPALNAME-in-RLS-for-Power-BI-Embedded/ba-p/1867670 for more information.
Question 5
You use an R visual to produce a map of 500,000 customers. You include the values of CustomerID, Latitude, and Longitude in the fields sent to the visual. Each customer ID is unique.
In powerbi.com, when users load the visual, they only see some of the customers.
What is the cause of the issue?
Answer : D
R visuals in the Power BI service have a few limitations including:
Data size limitations -- data used by the R visual for plotting is limited to 150,000 rows. If more than 150,000 rows are selected, only the top 150,000 rows are used and a message is displayed on the image. Additionally, the input data has a limit of 250 MB.
https://docs.microsoft.com/en-us/power-bi/visuals/service-r-visuals
Question 6
You have a Power Bl semantic model named Model! that contains two fields named Sales and Quarter. Model 1 contains a DAX measure that sums the Sales column.
You need to create a report that will contain the visual shown in the following exhibit.
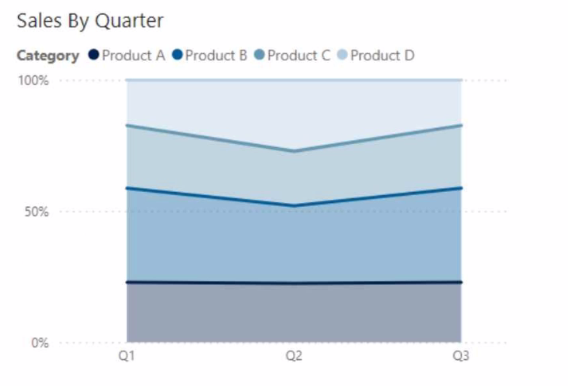
The solution must NOT require additional DAX measures.
Which type of visual should you use?
Answer : D
Question 7
You are reviewing a query that produces 10,000 rows in the Power Query Editor.
You need to identify whether a column contains only unique values.
Which two Data Preview options can you use? Each correct answer presents a complete solution.
NOTE: Each correct selection is worth one point.
Answer : A, B
B: Column distribution: This feature provides a set of visuals underneath the names of the columns that showcase the frequency and distribution of the values in each of the columns. The data in these visualizations is sorted in descending order from the value with the highest frequency.
By hovering over the distribution data in any of the columns, you get information about the overall data in the column (with distinct count and unique values).
A: Column profile: This feature provides a more in-depth look at the data in a column [compared to column distribution]. Apart from the column distribution chart, it contains a column statistics chart.
https://docs.microsoft.com/en-us/power-query/data-profiling-tools