Page: 1
/ 14
Total 685 questions
NAHQ Certified Professional in Healthcare Quality CPHQ Exam Questions
Question 1
An organization's culture is best assessed by examining the
Answer : A
An organization's culture is best assessed by examining the behavioral alignment with its core values. Culture is reflected in how closely the actions, decisions, and behaviors of employees at all levels align with the organization's stated values. When there is strong alignment, it indicates a cohesive culture that reinforces the organization's mission and vision. Conversely, a disconnect between behaviors and core values can signal cultural issues that need to be addressed.
Collaboration of medical staff and administration (B): Collaboration is important but is just one aspect of culture.
Number of performance improvement activities (C): The quantity of activities doesn't necessarily reflect cultural values or behaviors.
Involvement of each patient care department in strategic planning (D): While important, involvement in planning is more related to governance and strategy than to overall culture.
Reference
NAHQ Body of Knowledge: Organizational Culture and Core Values
NAHQ CPHQ Exam Preparation Materials: Assessing and Aligning Organizational Culture
Question 2
Sentinel events are most often the result of variations in:
Answer : C
Comprehensive and Detailed Explanation From Exact Extract:
Within the Patient Safety domain, sentinel events are typically traced to process failures --- breakdowns in how care is delivered, coordinated, or monitored.
Root cause analyses of sentinel events frequently reveal that system-level process design, not individual error or competence, is the main contributing factor.
Examples include communication failures, inadequate handoffs, or lack of standardized procedures.
Structural issues or staffing shortages may contribute indirectly, but process variation remains the predominant source of sentinel events in healthcare.
NAHQ CPHQ Content Outline -- Patient Safety: Event Analysis, Root Cause Identification, and System-Based Causes
NAHQ Healthcare Quality Competency Framework -- Patient Safety: Process Design and Risk Reduction
Question 3
One of the first steps in preparing for an organizational accreditation survey Is to have a quality professional
Answer : C
One of the first steps in preparing for an organizational accreditation survey is to conduct a gap analysis of the identified standards against current practices123.This involves understanding the accreditation standards and reviewing adherence to these standards before applying for accreditation1.A gap analysis helps identify areas of weakness or nonconformance to the standards2.This process is crucial in setting up the organization for success in the accreditation survey1.
https://www.carf.org/accreditation/survey-preparation-accreditation/
https://accreditation.org/accreditation-processes
Question 4
Which of the following types of surveillance refers to relying on another person to report a safety concern?
Answer : B
Surveillance methods in patient safety monitor risks or events, with different approaches based on how data is collected.
Option A (Retrospective): Retrospective surveillance reviews past data, not specifically relying on others to report.
Option B (Passive): This is the correct answer. The NAHQ CPHQ study guide states, ''Passive surveillance relies on voluntary reporting of safety concerns by individuals, such as staff or patients, without active data collection'' (Domain 1). Examples include incident reports submitted by others.
Option C (Prospective): Prospective surveillance plans for future data collection, not relying on others' reports.
Option D (Active): Active surveillance involves proactive data collection (e.g., audits), not waiting for reports.
CPHQ Objective Reference: Domain 1: Patient Safety, Objective 1.7, ''Implement surveillance methods for safety,'' includes passive surveillance for voluntary reporting. The NAHQ study guide notes, ''Passive surveillance depends on others to report safety issues'' (Domain 1).
Rationale: Passive surveillance relies on others' reports, aligning with CPHQ's safety monitoring principles.
Question 5
Which of the following leads to better population health management in older adults with chronic conditions?
Answer : B
A comprehensive assessment allows healthcare providers to understand the full scope of an older adult's health, including medical, functional, and psychosocial aspects. This holistic approach is essential for effective population health management and tailoring interventions to individual needs.
Question 6
An organization has compiled the scatter plots below:
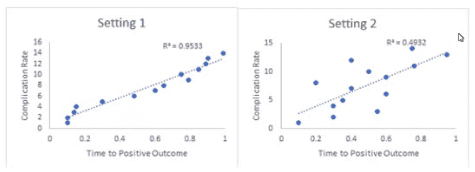
Based on these plots, which of the following conclusions can be made by the quality professional?
Answer : C
A scatter plot is a graphical tool that shows the relationship between two continuous variables by plotting data points at their corresponding values on the x-axis and y-axis1.
To interpret a scatter plot, we need to look at the direction, strength, and shape of the relationship between the variables2.
The direction of the relationship indicates whether the variables tend to increase or decrease together (positive correlation) or in opposite directions (negative correlation).
The strength of the relationship indicates how closely the data points cluster around a line or curve that best fits the data. A common measure of the strength of the linear relationship is the correlation coefficient , which ranges from -1 to 1.The closer the absolute value of R is to 1, the stronger the linear relationship2.
The shape of the relationship indicates whether the data points follow a straight line (linear relationship) or a curved pattern (nonlinear relationship).
Based on these criteria, we can analyze the scatter plots for Setting 1 and Setting 2 as follows:
Setting 1: The scatter plot shows a clear upward trend, indicating a positive correlation between complication rate and time to positive outcome. Thedata points are tightly clustered around a line, indicating a strong linear relationship. The R^2 value of 0.9533 on the plot is close to 1, which means that the linear model explains 95.33% of the variation in the complication rate. Therefore, we can conclude that Setting 1 has a strong positive correlation between complication rate and time to positive outcome.
Setting 2: The scatter plot shows a scattered pattern, indicating a weak or no correlation between complication rate and time to positive outcome. The data points are widely spread around a line, indicating a weak linear relationship. The R^2 value of 0.4923 on the plot is far from 1, which means that the linear model explains only 49.23% of the variation in the complication rate. Therefore, we cannot conclude that Setting 2 has a significant correlation between complication rate and time to positive outcome, or that complication rates are causing longer time to positive outcome at setting 2.
Question 7
The main goal of a clinical pathway/guideline Is lo
Answer : C
A clinical pathway/guideline is a tool that helps healthcare providers to deliver evidence-based, patient-centered, and standardized care for a specific condition or population12.
The main goal of aclinical pathway/guideline is to improve the quality and consistency of care, reduce unnecessary variations, optimize outcomes, and enhance patient satisfaction123.
A clinical pathway/guideline is not meant to assist in documentation of care (option A), although it may include documentation requirements as part of the quality improvement process1.
A clinical pathway/guideline is not meant to document practitioner variances (option B), although it may allow for deviations from the recommended care based on individual patient needs and preferences, clinical judgment, and resource availability12.Variances should be monitored and evaluated for their impact on outcomes and quality1.
A clinical pathway/guideline is not meant to ensure precise treatment plans are followed (option D), although it may provide recommendations for specific interventions, tests, or medications based on the best available evidence12.A clinical pathway/guideline should be flexible and adaptable to the local context and the patient's situation12.Reference:1:Clinical Pathways2:NICE clinical guidelines3:Clinical Practice Guidelines
 All Official Question Types