Page: 1
/ 14
Total 86 questions
Palo Alto Networks SD-WAN Engineer SD-WAN-Engineer Exam Questions
Question 1
Which component of Prisma SD-WAN is responsible for distributing User-IP and user-group mappings to branch devices that match the corresponding source IPs?
Answer : C
In the Prisma SD-WAN architecture, the Controller serves as the centralized management and control plane for the entire fabric. While the Cloud Identity Engine (CIE) is the component responsible for collecting and consolidating user-to-IP mappings from various identity providers (such as Active Directory, Okta, or Azure AD), it does not directly manage the distribution of this operational data to the individual ION devices at the branch level.
Instead, the Prisma SD-WAN Controller integrates with the Cloud Identity Engine to ingest these identity mappings. Once the Controller has synchronized the User-IP and user-group information, it acts as the primary orchestrator. It is responsible for distributing these mappings down to the ION devices across all sites. This distribution ensures that when an ION device sees traffic from a specific source IP, it can accurately associate that traffic with a specific user or group based on the metadata provided by the Controller.
By centralizing this distribution through the Controller, Prisma SD-WAN ensures consistency across the network. Branch ION devices can then apply Application-Based Path Selection and security policies based on user identity rather than just IP addresses. This architectural design offloads the processing requirements of maintaining direct connections to identity providers from the branch hardware, allowing the Controller to handle the heavy lifting of orchestration and global synchronization of identity data.
Question 2
Which component of the Prisma SD-WAN solution is responsible for the deep application identification (App-ID) and the generation of flow metrics (Network Transfer Time, Server Response Time) at the branch?
Answer : C
Comprehensive and Detailed Explanation
The ION Device Data Plane (the software running locally on the hardware appliance at the branch) is the component responsible for the heavy lifting of traffic analysis.
Edge Processing: Prisma SD-WAN uses an 'Application-Defined' architecture. The ION device performs Deep Packet Inspection (DPI) on the first few packets of a flow to identify the application (e.g., distinguishing 'Skype Video' from 'Skype Chat').
Metric Calculation: The ION device timestamping engine calculates the performance metrics (RTT, NTT, SRT) in real-time as packets pass through its interfaces. It aggregates this metadata.
Role of Controller (B): The Controller collects and visualizes this data (Analytics), but it does not generate it. The Controller does not sit in the data path of the user traffic. If the ION relied on the controller for App-ID, latency would be unacceptably high. Therefore, all detection and metric generation happens locally on the ION Device.
Question 3
While designing a greenfield Prisma SD-WAN solution for a retailer, the risk management group requires segmentation of the retail network to avoid one large fault domain.
The following data points are provided:
Two data centers and all sites need to access applications in both data centers
1000 retail branches with stores concentrated in multiple metropolitan areas
Data Center 1 and Data Center 2 have different sets of applications that are not replicated
Maintaining application availability is the primary goal
Which action will segment the retail network and reduce regional outages?
Answer : C
In large-scale Prisma SD-WAN deployments, such as a retail network with 1,000 branches, architectural resilience is achieved through a strategy known as Hub Clustering. A Data Center Cluster is a logical grouping of ION devices at a hub site that provides termination for branch-to-DC VPN tunnels. To prevent the creation of a massive, single fault domain, Palo Alto Networks best practices recommend segmenting the branch population across multiple clusters.
By creating more than one data center cluster in each data center and strategically assigning sites to these clusters, an administrator can effectively isolate failure events. In a metropolitan area where stores are concentrated, spreading nearby retail locations across different clusters ensures that a localized resource failure or a cluster-specific misconfiguration only impacts a subset of the stores in that region rather than causing a complete regional outage.
This design directly addresses the requirement for maintaining application availability. Since Data Center 1 and Data Center 2 host different applications, each branch site must maintain active paths to both DCs. By using multiple clusters at each DC, the risk management group's goal of avoiding a large fault domain is met through 'blast radius' containment. If Cluster A at Data Center 1 fails, the 1,000 sites are not all affected simultaneously; instead, only the specific sites bound to Cluster A lose connectivity to that hub, while their neighbors bound to Cluster B remain functional. This approach provides the highest level of regional resiliency and operational stability for high-density retail environments.
Question 4
Which action meets the needs of an organization that requires elevated incident notifications for its headquarters location?
Answer : C
In the Prisma SD-WAN (Instant-On Network) management framework, administrators can customize how events are handled and prioritized across different sites through Event Policies. An organization that requires 'elevated incident notifications' for a critical site like its headquarters needs a way to differentiate those alerts from standard branch notifications in the management portal and integrated third-party tools.
The most direct and effective method to achieve this is by configuring an Event Policy Rule specifically for the headquarters site. Within the incident policy framework, administrators can create rules that match specific resources---in this case, the headquarters site---and apply an action to set the priority. Priority levels typically range from P1 (highest) to P5 (lowest).1 By setting these to the highest level (P1), any generated incident for that site will immediately stand out on the dashboard as a high-priority event.
This approach is superior to other options because it changes the inherent importance of the alert within the Prisma SD-WAN logic itself. For example, a 'WAN Link Down' event at a small retail branch might be a P3, but the same event at the HQ could be elevated to a P1 via a custom policy rule. This elevation ensures that the Network Operations Center (NOC) is alerted more urgently and that external integrations, such as ServiceNow or PagerDuty, receive the correct priority mapping for immediate escalation. Options such as aggressive SLA thresholds (Option B) only increase the frequency of alerts, not necessarily their notification priority, while global syslog or SNMP settings (Options A and D) lack the site-specific granularity required for this use case.
Question 5
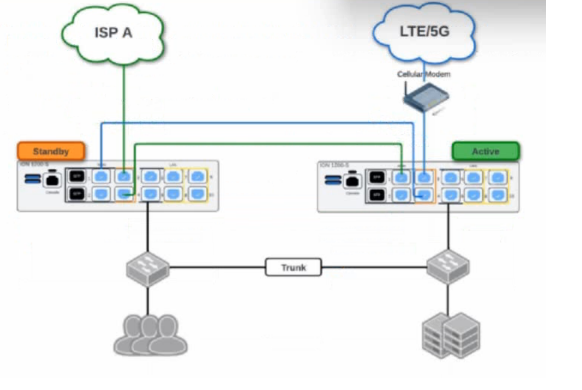
Based on the HA topology image below, which two statements describe the end-state when power is removed from the ION 1200-S labeled ''Active'', assuming that the ION labeled ''Standby'' becomes the active ION? (Choose two.)
Answer : A, C
Comprehensive and Detailed Explanation
This scenario depicts a High Availability (HA) topology utilizing the ION 1200-S model's Fail-to-Wire (bypass) capabilities to share WAN links between two devices without needing external switches for every WAN connection.
1. WAN Link Availability (Statement A):
The diagram illustrates a 'daisy-chain' cabling method supported by the ION 1200-S bypass pairs.
ISP A (Green): Connects directly to the 'Standby' (Left) unit first. Since the Standby unit remains powered on, it maintains direct access to ISP A.
LTE/5G (Blue): Connects to the 'Active' (Right) unit first. The connection then loops through a bypass pair on the Active unit to the Standby unit. When power is removed from the 'Active' unit, the fail-to-wire relays on its Ethernet ports close physically. This creates a passive electrical bridge that connects the LTE modem directly to the Standby unit. The Standby unit (now becoming Active) will detect the link state change and successfully utilize the LTE connection. Therefore, both WAN links remain usable.
2. LAN Failover Mechanism (Statement C):
Prisma SD-WAN ION devices typically use a VRRP-like mechanism for LAN redundancy.
When the 'Active' node fails (loses power), the 'Standby' node stops receiving keepalives and promotes itself to the Active state.
To ensure downstream switches and clients immediately send traffic to the new Active unit, it must update their ARP tables. It does this by broadcasting a Gratuitous ARP (GARP) packet for the Virtual IP (VIP) address of the Switch Virtual Interfaces (SVIs). This action informs the network that the MAC address associated with the Gateway I1P is now reachable via the port connected to the new Active ION.234
Question 6
Which implementation allows Prisma SD-WAN to improve application performance for organizations facing inconsistent user experiences across branch locations, especially due to varying device types and network conditions, by using Layer 4 and Layer 7 optimization to boost throughput?
Answer : D
Prisma SD-WAN addresses inconsistent application performance through Application Acceleration, which encompasses a suite of features designed to mitigate the effects of latency and packet loss.1 While basic SD-WAN functionality handles path selection, Application Acceleration goes further by employing Layer 4 (TCP) and Layer 7 (Application) optimizations. These optimizations are particularly effective for organizations with diverse branch environments where network conditions are unpredictable.
At Layer 4, Prisma SD-WAN implements TCP optimization techniques such as window scaling, selective acknowledgments, and congestion control algorithms.2 These mechanisms allow the ION devices to 'trick' the end hosts into sending data faster by acknowledging packets locally, effectively shielding the application from the round-trip time (RTT) delays inherent in long-distance WAN circuits. This significantly boosts throughput for bulk data transfers and legacy protocols that were not originally designed for high-latency environments.
At Layer 7, the system can perform application-specific optimizations, such as metadata caching or protocol-specific acceleration for services like SMB or HTTP.3 By reducing the number of 'chatty' exchanges required to complete a transaction, Prisma SD-WAN ensures a snappy, consistent user experience regardless of whether the user is on a high-speed fiber link or a degraded cellular connection. This is distinct from Forward Error Correction (FEC) (Option C) or Packet Duplication (Option A), which focus on reconstructing lost packets rather than optimizing the protocol throughput itself. By combining these L4 and L7 techniques, Application Acceleration ensures that business-critical SaaS and data center applications perform optimally across the entire distributed enterprise.
Question 7
When planning a software upgrade for a large fleet of ION devices, what is the recommended best practice regarding the "Software Version" assigned in the Site Summary?
Answer : C
Comprehensive and Detailed Explanation
The best practice for managing upgrades in a large-scale Prisma SD-WAN environment is the Canary or Phased Rollout approach, utilizing Site Tags.
Risk Mitigation: Upgrading all sites simultaneously (Option B) is highly risky. If the new software version has an unforeseen bug or compatibility issue with a specific circuit type, the entire network could face an outage.
Tag-Based Management: Administrators should create tags such as 'Upgrade-Phase-1' (Pilot sites) or 'Region-North'. By assigning the specific Software Version to the Tag (rather than the individual site or the global default), the controller pushes the update only to that subset of devices.
Procedure:
Apply update to 'Pilot' tag (5 sites). Monitor for 24-48 hours.
Apply update to 'Region-1' tag (50 sites). Monitor.
Eventually, update the Global default once confidence is high.
Option A is unscalable, and Option D is incorrect as the administrator retains full control over when upgrades occur; they are not forced automatically without policy configuration.
 All Official Question Types