Page: 1
/ 14
Total 200 questions
IASSC Certified Lean Six Sigma Green Belt ICGB-IASSC Exam Practice Test
Question 1
To create standardization of financial benefit calculations project savings are typically based on savings over what period of time?
Answer : B
Question 2
Which statement(s) are true about the Fitted Line Plot shown here? (Note: There are 2 correct answers).
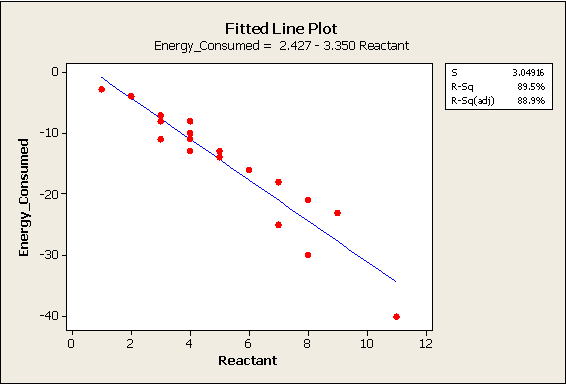
Answer : C, D
Question 3
Which element of waste best describes "the cost of an idle resource"?
Answer : A
Question 4
In the late 1980's William Smith coined the name Six Sigma for a methodology that had its origins at __________________ for quality related work being done there.
Answer : D
Question 5
Non-parametric testing is done when which of these are applicable? (Note: There are 3 correct answers).
Answer : B, C, D
Question 6
For the data shown here a Belt suspects the three grades are supplying the same results.
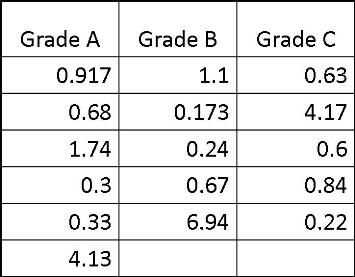
Which statement(s) are true for proper Hypothesis Testing?
Answer : D
Question 7
A Belt concludes a Lean Six Sigma project with the creation of a Control Plan. At what point can the Control Plan be closed?
Answer : A