Page: 1
/ 14
Total 1320 questions
PMI Certified Associate in Project Management CAPM Exam Questions
Question 1
Organizations perceive risks as:
Answer : B
According to the PMBOK Guide and the PMI Lexicon of Project Management Terms, the definition of risk is centered on the concept of 'uncertainty.'
Definition of Individual Project Risk: An uncertain event or condition that, if it occurs, has a positive or negative effect on one or more project objectives (such as scope, schedule, cost, and quality).
The 'Effect of Uncertainty': This specific phrasing---'the effect of uncertainty'---is the standard definition used by both PMI and ISO 31000. It acknowledges that risk is not just about the event itself, but how the lack of certainty regarding that event influences the ability of the organization to reach its goals.
Positive vs. Negative: Organizations view risk as a 'double-edged sword.' While many people equate risk only with threats (negative), professional project management recognizes opportunities (positive risks) as well. Therefore, defining it simply as a 'negative impact' (as in options C and D) is incomplete.
Organizational Risk Appetite: How an organization perceives these uncertainties depends on its Risk Appetite (the degree of uncertainty it is willing to take on) and Risk Threshold (the level of impact at which a stakeholder may have a specific interest).
Comparison with other options:
A . events that will inevitably impact...: Risk is by definition uncertain. If an event is 'inevitable' (100% probability), it is no longer a risk; it is a fact or an issue that must be managed as a known constraint.
C . events which could have a negative impact...: This describes Threats. While correct in a narrow sense, it ignores the 'Opportunities' side of risk management (positive risks).
D . the negative impact of undesired events...: Similar to option C, this focuses exclusively on the negative aspect. Professional project management seeks to maximize opportunities just as much as it seeks to minimize threats.
Question 2
Which basic quality tool explains a change in the dependent variable in relationship to a change observed in the corresponding independent variable?
Answer : D
According to the PMBOK Guide, specifically within the Project Quality Management knowledge area, the Scatter Diagram is one of the seven basic quality tools used to analyze data.
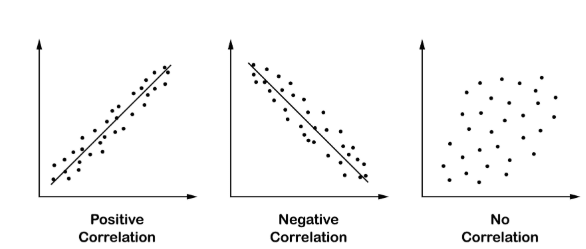
Definition and Purpose: A scatter diagram (also known as a correlation chart) is used to explain a change in a dependent variable ($Y$) in relationship to a change observed in a corresponding independent variable ($X$). It plots pairs of numerical data, with one variable on each axis, to look for a relationship between them.
Correlation: If the variables are correlated, the points will fall along a line or curve. The better the correlation, the tighter the points will hug the line.
Positive Correlation: Both variables increase together.
Negative Correlation: One variable increases while the other decreases.
No Correlation: No apparent relationship exists between the variables.
Application: In project management, this tool is frequently used during the Manage Quality and Control Quality processes to identify the root cause of issues by seeing if a specific factor (like temperature, training hours, or pressure) is actually causing the observed defects or performance variations.
Comparison with other options:
A . Cause-and-effect diagram: Also known as a Fishbone or Ishikawa diagram. It is used to identify the various factors that might be causing a problem (root cause analysis), but it does not mathematically plot the relationship between two specific variables.
B . Histogram: A special form of a bar chart used to describe the central tendency, dispersion, and shape of a statistical distribution. it shows the frequency of occurrences but not the relationship between two different variables.
C . Control chart: Used to determine whether or not a process is stable or has predictable performance. It tracks a single variable over time against upper and lower control limits, rather than comparing two different variables against each other.
Question 3
The process of monitoring the status of the project and product scope as well as managing the changes to the scope baseline is known as:
Answer : C
According to the PMBOK Guide (Project Management Body of Knowledge), specifically within the Project Scope Management knowledge area, the definition of monitoring and managing baseline changes is attributed to the Control Scope process:
Control Scope (Option C): This is the process of monitoring the status of the project and product scope and managing changes to the scope baseline. It ensures that all requested changes and recommended corrective or preventive actions are processed through the Perform Integrated Change Control process. It is also used to manage 'scope creep'---the uncontrolled expansion to product or project scope without adjustments to time, cost, and resources.
Validate Scope (Option A): This is the process of formalizing acceptance of the completed project deliverables. While it is a monitoring and controlling process, its primary focus is on customer acceptance rather than managing changes to the baseline.
Plan Scope Management (Option B): This is a planning process that creates a scope management plan that documents how the project and product scope will be defined, validated, and controlled. It sets the 'how-to' but does not perform the monitoring itself.
Define Scope (Option D): This is the process of developing a detailed description of the project and product. This occurs during the planning phase and results in the Project Scope Statement, which becomes an input to the scope baseline.
In the standard PMI framework, Control Scope is essential for maintaining the integrity of the scope baseline throughout the project life cycle.
Question 4
Projects programs subsidiary portfolios.... objectives refer to?
Projects, programs, subsidiary portfolios, and operations managed as a group to achieve strategic objectives refers to?
Answer : D
According to the PMBOK Guide and the Standard for Portfolio Management, the definition of a portfolio is central to understanding organizational project management (OPM).
Portfolio Management (Choice D): A portfolio is defined as a collection of projects, programs, subsidiary portfolios, and operations managed as a group to achieve strategic objectives. The focus of portfolio management is to ensure that the organization is 'doing the right work' by selecting and prioritizing programs and projects that align with the organization's business strategy and investment goals.
Program Management (Choice C): This refers to the management of a group of related projects, subsidiary programs, and program activities in a coordinated way to obtain benefits not available from managing them individually. It does not typically include operations or unrelated strategic groupings.
Project Management (Choice B): This is the application of knowledge, skills, tools, and techniques to project activities to meet the project requirements. It focuses on the successful delivery of a single endeavor.
Operations Management (Choice A): This is concerned with the ongoing production of goods and/or services. While operations are included in a portfolio for strategic alignment and resource allocation purposes, 'Operations Management' itself is the management of those ongoing processes, not the strategic grouping of projects and programs.
The inclusion of operations and subsidiary portfolios in the list is the key differentiator that points directly to Portfolio Management. Portfolios allow high-level visibility into how all organizational work, both temporary (projects/programs) and ongoing (operations), contributes to the high-level strategic roadmap.
Question 5
The degree of uncertainty an entity is willing to take on in anticipation of a reward is known as its risk:
Answer : D
According to the PMBOK Guide (Project Management Body of Knowledge), specifically within the Project Risk Management knowledge area, it is critical to distinguish between the various terms related to an organization's attitude toward risk:
Risk Appetite (Option D): This is defined as the degree of uncertainty an entity is willing to take on in anticipation of a reward. It reflects the organization's management philosophy and influences the culture and style of the organization. Essentially, it answers the question: 'How much risk are we willing to hunt for or accept to achieve our goals?'
Risk Tolerance (Option C): While often confused with appetite, risk tolerance is the specified amount of risk that an organization or individual is willing to settle for. It is often more measurable and acts as a 'buffer' around an objective. (Note: In newer PMI standards, 'Tolerance' is frequently replaced by 'Risk Thresholds').
Risk Response (Option B): This refers to the specific actions or strategies (such as Avoid, Transfer, Mitigate, or Accept) that the project team decides to implement to address identified risks. It is an action, not an attitude or degree of uncertainty.
Risk Management (Option A): This is the entire Knowledge Area and the systematic process of identifying, analyzing, and responding to project risk. It is the framework, not the specific measure of willingness to take risks.
In the PMI framework, understanding Risk Appetite is a prerequisite for the Plan Risk Management process, as it helps the project manager determine the stringency and type of risk management activities that will be appropriate for the performing organization.
Question 6
Which of the following techniques is used during Control Scope?
Answer : B
According to the PMBOK Guide, Control Scope is the process of monitoring the status of the project and product scope and managing changes to the scope baseline. The primary goal is to ensure that all requested changes and recommended corrective or preventive actions are processed through the Perform Integrated Change Control process.
One of the key Tools and Techniques used in this process is Variance Analysis.
Mechanism: Variance analysis is used to compare the baseline (the Project Scope Statement, WBS, and WBS Dictionary) against the actual results (the work that has been performed) to determine if a variance exists.
Purpose: It helps the project manager determine the magnitude and cause of any deviations from the scope baseline. If the 'actual' scope performed differs from the 'planned' scope, the project manager must decide whether corrective or preventive action is required.
Scope Creep: This technique is essential for identifying Scope Creep, which is the uncontrolled expansion of product or project scope without adjustments to time, cost, and resources. By constantly comparing actual work to the baseline, the team can catch unauthorized work early.
Analysis of other choices:
Choice A (Cost-benefit analysis): This is typically used during the Initiation phase (to justify a project) or during Plan Quality Management to determine the trade-off between the cost of quality and the expected benefit. It is not a primary tool for controlling scope.
Choice C (Reserve analysis): This technique is used in Control Costs and Control Risks. It involves checking the status of contingency and management reserves to see if they are still needed or if additional reserves are required. It does not measure scope performance.
Choice D (Stakeholder analysis): This is used in Identify Stakeholders and Plan Stakeholder Engagement to understand the influence, interests, and impact of project stakeholders. While stakeholders influence scope, 'Stakeholder Analysis' is not the technical tool used to monitor scope performance against a baseline.
Question 7
Which of the following is used to classify stakeholders based on their assessments of power, urgency, and legitimacy?
Answer : C
According to the PMBOK Guide (6th Edition), the Salience Model is a specific tool used for stakeholder analysis that categorizes stakeholders based on three distinct attributes:
Power: The level of authority or ability a stakeholder has to influence the project outcome.
Urgency: The degree to which a stakeholder's claims require immediate attention (based on time constraints or the stakeholder's high stake in the outcome).
Legitimacy: The perceived validity or appropriateness of the stakeholder's involvement or claim.
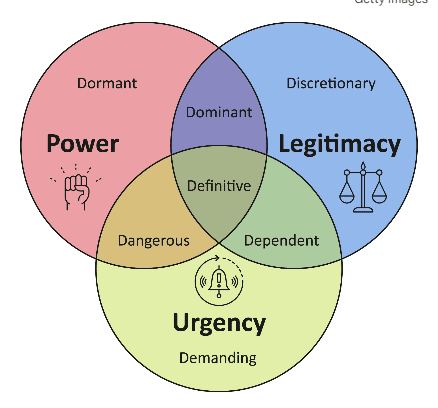
Why the Salience Model is used: This model is particularly useful in large, complex projects or where there are vast networks of stakeholders. By identifying where stakeholders overlap in these three areas (e.g., 'Definitive' stakeholders possess all three), project managers can prioritize their engagement efforts and determine which stakeholders require the most proactive management.
Analysis of Distractors:
A (Power/interest grid): This is a simpler classification tool that groups stakeholders based on their level of authority (power) and their level of concern (interest) regarding the project. It does not account for urgency or legitimacy.
B (Stakeholder cube): This is a three-dimensional model that combines the grid elements into a multi-dimensional representation (e.g., Power, Interest, and Attitude). While more complex than a grid, it is not the specific model defined by power, urgency, and legitimacy.
D (Directions of influence): As discussed in previous questions, this classifies stakeholders by their relationship to the project team (Upward, Downward, Outward, Sideward) rather than by their inherent attributes of power or urgency.
 All Official Question Types