Page: 1
/ 14
Total 50 questions
Qlik Sense Data Architect Certification Exam - 2024 QSDA2024 Exam Questions
Question 1
A data architect needs to write the expression for a measure on a KPI to show the sales person with the highest sales. The sort order of the values of the fields is unknown. When two or more sales people have sold the same amount, the expression should return all of those sales people.
Which expression should the data architect use?
A)

B)

C)

D)

Answer : A
The requirement is to create a measure that identifies the salesperson with the highest sales. If multiple salespeople have the same highest sales amount, the measure should return all of those salespeople.
Explanation of Option A:
Rank(Sum(Sales), 1): The Rank() function is used to rank salespersons based on the sum of their sales. The rank 1 indicates the top position.
Aggr() Function: This function aggregates the data and returns the results grouped by the SalesPerson field.
IF() Condition: The IF condition checks if the salesperson's rank is 1 (highest sales).
Concat(DISTINCT ...): The Concat() function concatenates all the salespersons who have the highest sales, separated by spaces or another delimiter, ensuring that all top performers are returned.
Example:
If three salespersons have the highest sales, this expression will return all three names separated by a space.
Question 2
Refer to the exhibit.
Refer to the exhibit.
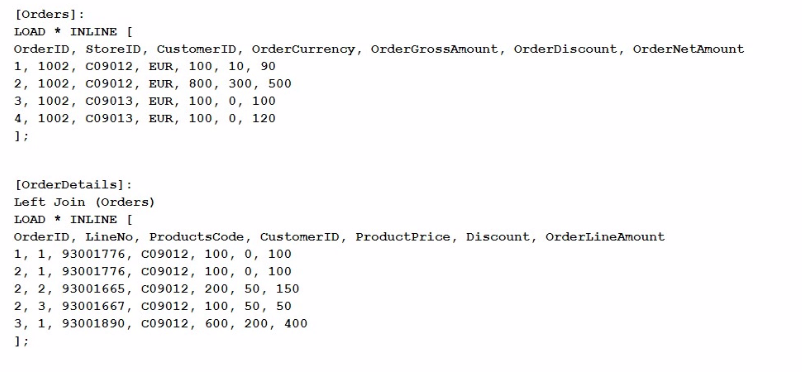
What does the expression sum< [orderMetAmount ]) return when all values in LineNo are selected?
Answer : B
The expression sum([OrderNetAmount]) sums the values in the OrderNetAmount field across the dataset. Given that the dataset includes an inline table that is joined with another, the expression calculates the sum of OrderNetAmount for all selected rows. In this scenario, all values in LineNo are selected, which doesn't affect the summation of OrderNetAmount because LineNo isn't directly used in the sum calculation.
Step-by-step Calculation:
The Orders table contains the OrderNetAmount for each order. The values provided are 90, 500, 100, and 120.
Adding these values together: 90+500+100+120=81090 + 500 + 100 + 120 = 81090+500+100+120=810
However, after the Left Join operation with the OrderDetails table, some of these rows might be duplicated if the join results in multiple matches. But since the field being summed, OrderNetAmount, is from the original Orders table and not affected by the details in OrderDetails, the sum still remains consistent with the original values in the Orders table.
Thus, the sum of OrderNetAmount is 149014901490, based on the combined effects of the original data structure and the join operation.
Question 3
A data architect implements Section Access on an app to reduce the data for each user when the user logs in. Each user is allowed to see their specific territory only.
The app is set for a scheduled reload every three hours. Without Section Access added, the app loads successfully. When Section Access is added and the script runs, the app fails to load.
What is causing this issue?
Answer : B
When implementing Section Access in Qlik Sense, it is crucial that all accounts that need to access the data---including the service account that performs the scheduled reload---are included in the Section Access table. If the service account is not included, Qlik Sense will not be able to access any data, leading to a failure in the reload process.
Here's a breakdown of why the other options are less likely:
A . The ACCESS column in the Section Access table has been added in lowercase: This would generally result in a syntax error, but it would not allow the script to execute successfully without causing an immediate failure, unrelated to Section Access.
C . A user name listed in the Section Access table is spelled incorrectly: While this could lead to some users not having the correct access, it would not cause the entire reload to fail. The issue here is broader, affecting the entire application load process.
D . The data architect does not have rights to reload the app: If the architect did not have rights, the script would not run successfully even without Section Access.
The correct issue in this scenario is that the service account running the task is not included in the Section Access table. This is a common cause of load failures after adding Section Access. To resolve this, ensure that the service account is added with sufficient privileges in the Section Access table
Question 4
Exhibit.
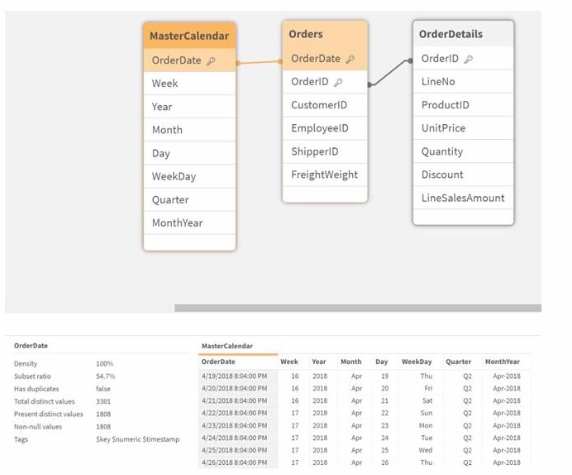
Refer to the exhibit.
A business analyst informs the data architect that not all analysis types over time show the expected data.
Instead they show very little data, if any.
Which Qlik script function should be used to resolve the issue in the data model?
Answer : D
In the provided data model, there is an issue where certain types of analysis over time are not showing the expected data. This problem is often caused by a mismatch in the data formats of the OrderDate field between the Orders and MasterCalendar tables.
Option A: DatefFloor(OrderDate)) would round down to the nearest date boundary, which might not address the root cause if the issue is related to different date and time formats.
Option B: TimeStamp#(OrderDate, 'M/D/YYYY hh.mm.ff') ensures that the date is interpreted correctly as a timestamp, but this does not resolve potential mismatches in date format directly.
Option C: TimeStamp(OrderDate) will keep both date and time, which may still cause mismatches if the MasterCalendar is dealing purely with dates.
Option D: Date(OrderDate) formats the OrderDate to show only the date portion (removing the time part). This function will ensure that the date values are consistent across the Orders and MasterCalendar tables by converting the timestamps to just dates. This is the most straightforward and effective way to ensure consistency in date-based analysis.
In Qlik Sense, dates and timestamps are stored as dual values (both text and numeric), and mismatches can lead to incomplete or incorrect analyses. By using Date(OrderDate) in both the Orders and MasterCalendar tables, you ensure that the analysis will have consistent date values, resolving the issue described.
Question 5
A data architect needs to upload data from ten different sources, but only if there are any changes after the last reload. When data is updated, a new file is placed into a folder mapped to E:\486396169. The data connection points to this folder.
The data architect plans a script which will:
1. Verify that the file exists
2. If the file exists, upload it Otherwise, skip to the next piece of code.
The script will repeat this subroutine for each source. When the script ends, all uploaded files will be removed with a batch procedure. Which option should the data architect use to meet these requirements?
Answer : D
In this scenario, the data architect needs to verify the existence of files before attempting to load them and then proceed accordingly. The correct approach involves using the FileExists() function to check for the presence of each file. If the file exists, the script should execute the file loading routine. The FOR EACH loop will handle multiple files, and the IF statement will control the conditional loading.
FileExists(): This function checks whether a specific file exists at the specified path. If the file exists, it returns TRUE, allowing the script to proceed with loading the file.
FOR EACH: This loop iterates over a list of items (in this case, file paths) and executes the enclosed code for each item.
IF: This statement checks the condition returned by FileExists(). If TRUE, it executes the code block for loading the file; otherwise, it skips to the next iteration.
This combination ensures that the script loads data only if the files are present, optimizing the data loading process and preventing unnecessary errors.
Question 6
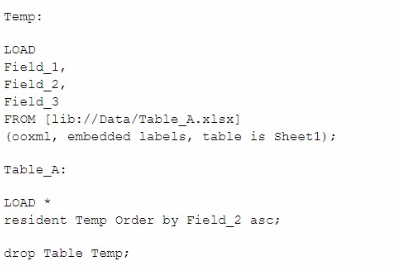
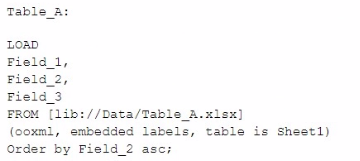
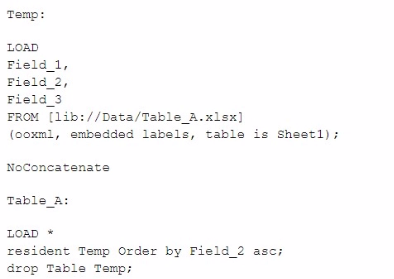
A data architect needs to load Table_A from an Excel file and sort the data by Reld_2.
Which script should the data architect use?
A)
B)
C)
D)
Answer : A
In this scenario, the data architect needs to load Table_A from an Excel file and ensure that the data is sorted by Field_2. The key here is to correctly load and sort the data in the script.
Understanding the Options:
Option A:
First, it loads the data into a temporary table (Temp) from the Excel file.
Then, it loads the data from the temporary table (Temp) into Table_A, using the ORDER BY Field_2 ASC clause to sort the data by Field_2.
Finally, it drops the temporary table (Temp), leaving the sorted data in Table_A.
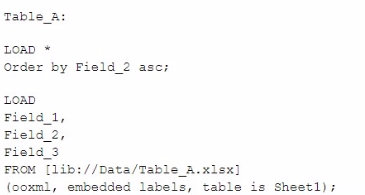
Option B:
Directly loads the data from the Excel file into Table_A and applies the ORDER BY Field_2 ASC clause in the same step.
However, the ORDER BY clause in a direct load from an external source like Excel might not work as expected because Qlik Sense does not support ORDER BY when loading directly from a file.
Option C:
Similar to Option A but uses the NoConcatenate keyword to prevent concatenation, which is unnecessary since Temp and Table_A have different names.
While this script works, the NoConcatenate keyword is redundant in this context.
Option D:
The ORDER BY Field_2 ASC is placed before the LOAD statement, which is not a correct usage in Qlik Sense script syntax.
Correct Script Choice:
Option A is the correct script because it correctly sorts the data after loading it into a temporary table and then loads the sorted data into Table_A. This method ensures that the data is sorted by Field_2 and avoids any issues related to sorting during the initial data load.
Qlik Sense Scripting Best Practices: When sorting data in Qlik Sense, the correct approach is to use a RESIDENT LOAD with an ORDER BY clause after loading the data into a temporary table.
Question 7
Exhibit.
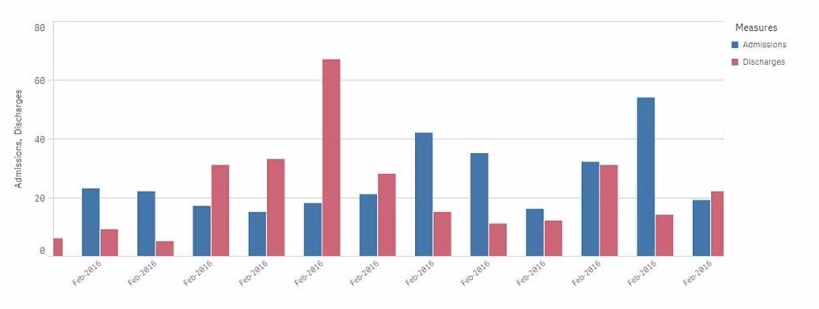
A chart for monthly hospital admissions and discharges incorrectly displays the month and year values on the x-axis.
The date format for the source data field "Common Date" is M/D/YYYY. This format was used in a calculated field named "Month-Year" in the data manager when the data model was first built.
Which expression should the data architect use to fix this issue?
Answer : A
The issue described relates to the incorrect display of month and year values on the x-axis of a chart. The source data has dates in the M/D/YYYY format, and a calculated field named Month-Year was created using this date format.
To correct the issue:
The correct approach is to use the MonthStart() function, which returns the first date of the month for the provided date. This ensures consistency in month-year representation.
The Date() function is then used to format the result of MonthStart() to the desired format of MMM-YYYY (e.g., Feb-2018).
Explanation of the Correct Expression:
MonthStart([Common Date]): This ensures that all dates within a month are treated as the first day of that month, which is critical for accurate monthly aggregation.
Date(..., 'MMM-YYYY'): This formats the result to show just the month and year in the correct format.
Using this expression ensures that the x-axis correctly displays the month-year values.