Page: 1
/ 14
Total 50 questions
QlikView 12 Business Analyst Certification QV12BA Exam Questions
Question 1
Refer to the exhibit.
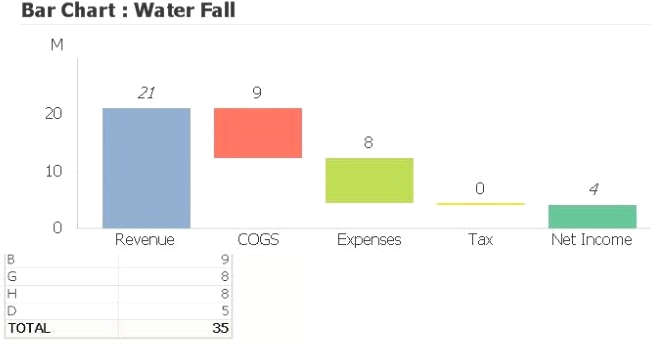
A business analyst creates a water fall chart to understand how an initial value is affected by a series of intermediate positive and negative values.
Which two actions must a business analyst perform to create the water fall chart shown? (Select two )
Answer : C, E
Question 2
Refer to the exhibit
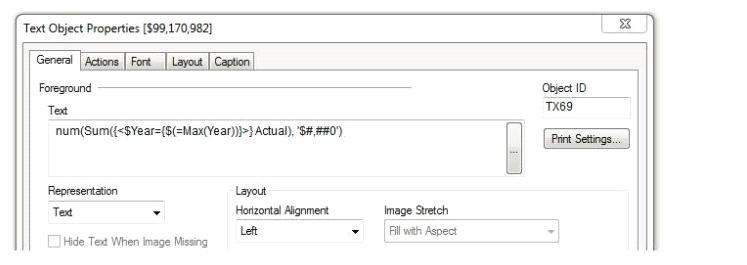
A business analyst needs to present the actual sales of the current year in a KPI on a dashboard. The expression in the Text field is NOT working
Which two changes will correct the expression? (Select two )
Answer : A, B
Question 3
A business analyst needs to open another GlikView document by trigger Which two options can be used to perform this task? (Select two.)
Answer : D, E
Question 4
A business analyst wants to represent the relationship between two key performance indicators How should the business analyst meet these requirements?
Answer : D
Question 5
A data model contains 1 billion records and a straight table renders all of the data at the most granular level. The business users do NOT need all of the detailed information. The business analyst needs to improve the rendering time of the straight table.
Which two approaches should the analyst use? (Select two )
Answer : C, E
Question 6
Two of the tables in the QlikView data model are InvoiceHeader (one million rows) and InvoiceDetail (nine million rows) InvoicelD links the two Invoice tables.
This expression is used several times in the QlikView application, count (distinct invoiceiT)
How can a business analyst optimize this expression for use in the application?
Answer : D
Question 7
Refer to the exhibit.
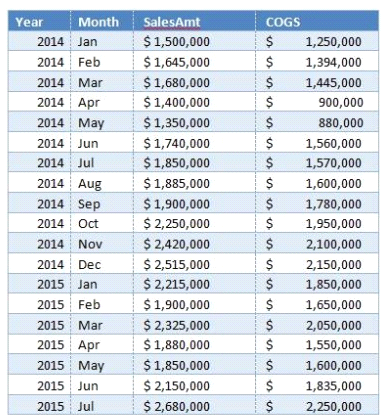
The dataset shown has been loaded into a QhkView application The user has selected the year 7015' to analyze
This expression is used to calculate a value:
Num((Sum({!<[Month] = {'May'} >> SalesAmt-COGS)/Sum({1<[Month] = {'May*} >} SalesAmt)), #,##0.0**)
What is the result?
What is the result?
Answer : D