Page: 1
/ 14
Total 116 questions
Salesforce Certified CRM Analytics and Einstein Discovery Consultant Analytics-Con-201 Exam Questions
Question 1
Acompany wants to create a timeline chart to visualize the evolution of its Closed Won opportunities.
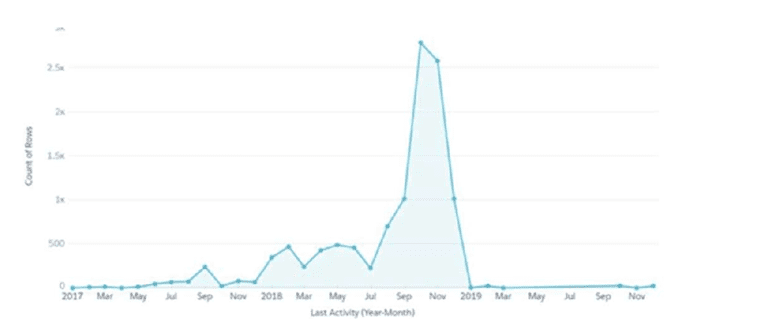
What are the required parameters to build a lens that displays output similar to the image shown?
Answer : C
To create a timeline chart similar to the one shown, the following parameters are typically required:
1 Measure: This could be the count of Closed Won opportunities or any other relevant metric that needs to be tracked over time.
1 Grouping by a Date Field: This is essential to plot the timeline effectively. The date field would typically be the close date of the opportunities.
Additional Groupings: Depending on the complexity and the detail needed, additional groupings can be added. For example, grouping by region or product line can provide more insights into the timeline. If trellis is used, it allows for the creation of multiple smaller charts within the main chart, each representing a slice of data based on the additional groupings.
This setup helps visualize the evolution of Closed Won opportunities over time, making it easy to spot trends, seasonal patterns, or other relevant insights.
Question 2
A CRM Analytics consultant is updating an existing recipe.
They are looking to add a few additional fields onto the Account dataset. One of the fields to be added is a multi-select picklist field that needs to be shown as text on the dashboard.
What should the consultant do to accomplish this?
Answer : A
Question 3
A CRM Analytics consultant is working on Sales dashboards with multiple datasets and advanced queries in the Sales Analytics app.
Sales managers in the organization have been given Editor/Manager access to the app, whereas sales reps have been given Viewer access.
Some dashboards that are in progress are not ready to be rolled out to sales reps and should only be viewable by sales managers.
How should the consultant accomplish this?
Answer : C
In CRM Analytics, you can control the visibility of dashboards and other assets using theasset visibilityfeature. This allows the consultant to restrict access to specific assets (like dashboards) for certain groups of users, such as sales reps, without needing to duplicate datasets or move dashboards to another app. This is the most efficient way to manage access for dashboards in progress while allowing only sales managers to view the in-progress dashboards.
Question 4
Cloud Kicks (CK) wants to use CRM Analytics to analyze trends of its sales pipeline in order to accelerate the company's sales process. To do so, CK needs to know the average time an opportunity
spends in each stage. The data can be found in the Opportunity History object, but the value is not pre-calculated in Salesforce, so a consultant recommends using a recipe to calculate it.
How should the consultant use a recipe to calculate the average time an opportunity spends in each stage?
Answer : C
Question 5
Universal Containers plans to upload target data from an external tool to CRM Analytics so it can calculate the sales team target attainments.
The target data changes every month, so the datasets need to be updated on a monthly basis. The target data is a CSV file that contains the Salesforce ID of the sales rep, the target amount, and the month of the target. For each sales rep, the file contains a target for every month of the current year as well as all previous years.
Based on this information, which operation should a consultant use with the Analytics External Data API to upload the file?
Answer : A
For uploading target data that changes on a monthly basis and includes historical data (previous years' targets), the appropriate operation is 'Overwrite.' This ensures that each time the CSV file is uploaded, the existing data in the dataset is replaced with the new data. This is critical because the target data includes both current and historical data, and using 'Overwrite' will update the entire dataset while maintaining historical accuracy.
'Append' would add new data without replacing the old records, leading to duplication, and 'Update' is not suitable for completely replacing data in this context.
Question 6
In Data Alerts, a field named Region is 96.5% North America. The consultant believes that this is an important field since the majority of sales is in the North American market.
What is the appropriate action?
Answer : B
Question 7
Cloud Kicks needs a CRM Analytics consultant to install the Appointment Analytics App. After installation, they realize the wrong field was picked and the app did not have access to a newly created field that should be used instead of the old one.
What is the first step the consultant should take to prevent erroneous dataset/dashboard creation?
Answer : B
If the wrong field is selected in the initial setup of an app or dataset, it is important to stop any data processing activities (like recipe executions) to prevent erroneous data from being loaded into datasets and dashboards. In this case, stopping the recipe from running in Data Manager is the correct first step. Once the recipe is stopped, the consultant can update the field selection or make other necessary corrections before restarting the process.
 All Official Question Types