Page: 1
/ 14
Total 174 questions
Salesforce Certified Tableau Data Analyst Analytics-DA-201 Exam Questions
Question 1
You have the Mowing dashboard.
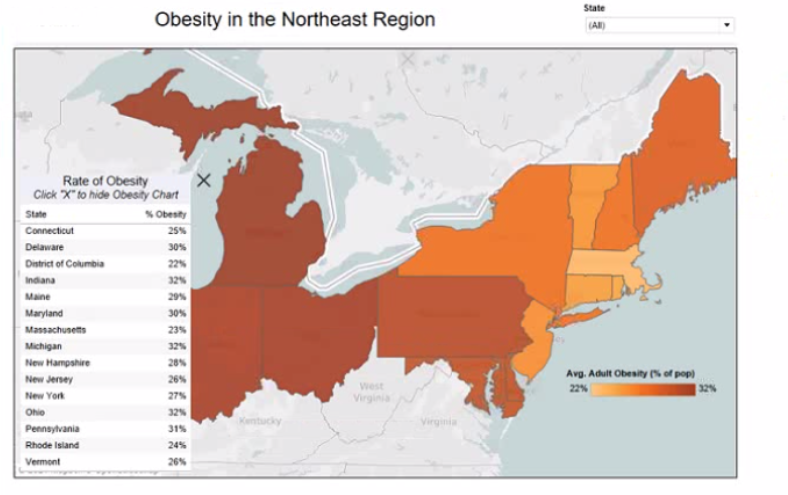
Which two elements are floating? Choose two.
Answer : A, D
In Tableau dashboards, floating elements are those that can be freely moved over the dashboard canvas without being snapped into the tiled layout. The floating elements are often indicated by their standalone frames and the ability to overlap with other dashboard items. From the provided image, the state filter and the Rate of Obesity chart can be identified as floating if they can be moved independently of the tiled grid layout that constrains other elements.
Question 2
You have two tables named Employeelnfo and DepartmentInfo. Employeelnfo contains four fields named Full Name, Department ID, Start Date, and Salary.
DepartmentInfo contains four fields named Department Name, Size, Department ID, and VP.
You want to combine the tables to meet the following requirements:
. Each record in Employeelnfo must be retained in the combined table.
. The records must contain the Department Name, Size, and VP fields.
* Every record must have a full name.
Which type of join should you use?
Answer : B
To combine the tables and meet the requirements, you should use a left join. A left join will keep all the records from the left table (Employeelnfo) and match them with the records from the right table (DepartmentInfo) based on the common field (Department ID). If there is no matching record in the right table, the fields from the right table will be null. This way, you will retain all the records from Employeelnfo, and also include the Department Name, Size, and VP fields from DepartmentInfo. Every record will have a full name because it is a field from the left table. A left join will look like this:
Join Your Data - Tableau
Join Types in Tableau
Question 3
You have the following dataset.
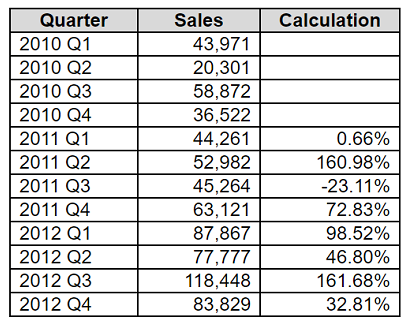
Which formula calculates the percent difference in sales relative to the same quarter the previous year as shown in the Calculation field?
Answer : B
The formula in option B calculates the percent difference in sales relative to the same quarter the previous year. It subtracts the sales of the same quarter from the previous year from the current year's sales, and then divides this by the previous year's sales. This gives a percentage change, which aligns with what is shown in the Calculation field of your dataset. The LOOKUP function returns the value of a specified offset from the current row in the partition. In this case, the offset is -4, which means the value of the same measure four rows above the current row. This corresponds to the same quarter of the previous year, assuming the data is sorted by quarter.Reference:
LOOKUP Function - Tableau
Table Calculations - Tableau
Tableau Certified Data Analyst Study Guide
Question 4
You have a data source that has two tables named Table1 and Table2. Table1 is the primary table and Table2 is the secondary table.
You want to combine the tables by using Tableau Prep. The combined table must include only values from Table1 that do NOT match any values in Table2. The field values from Table2 must appear as null values.
Which type of join should you use?
Answer : A
To combine the tables by using Tableau Prep and include only values from Table1 that do not match any values in Table2, you should use a left only join. A left only join is a type of join that returns only the rows from the primary table (Table1) that have no matching rows in the secondary table (Table2). The field values from Table2 will appear as null values in the combined table. A left only join is also known as an anti-join or an exclusion join.Reference:
Tableau Certified Data Analyst Exam Prep Guide, page 9, section ''Preparing Data''
Tableau Help: Join Your Data
Tableau Help: Left Only Join
Question 5
Which function should a Data Analyst use to average sales at a less-granular level of detail than is in the view?
Answer : D
Question 6
You have a sales dataset that contains the following fields.
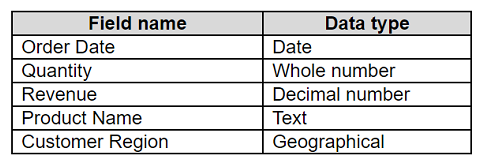
You need to analyze the average revenue per product in different regions over time.
Which two fields should be measures? Choose two.
Answer : D, E
To analyze the average revenue per product in different regions over time, you need to use two fields that contain numeric, quantitative values that you can measure and aggregate. Quantity and Revenue are both measures that fit this criterion. You can multiply Quantity and Revenue to get the total sales for each product, and then divide by the number of products to get the average revenue. You can also use these measures to create charts and tables that show the trends and comparisons over time and across regions.Reference:
Dimensions and Measures, Blue and Green - Tableau
Tableau Certified Data Analyst Study Guide
Question 7
You have the following data source in tableau Server.
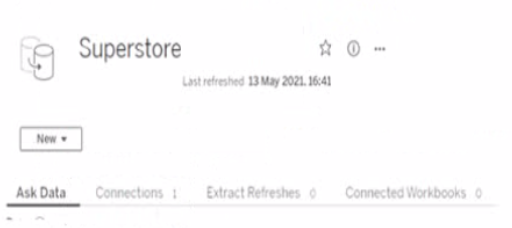
You need to ensure that the data is updated every hour.
What should you select?
Answer : B
To ensure that the data is updated every hour, you need to select Extract Refreshes from the data source menu on Tableau Server. This will allow you to add a new extract refresh schedule or edit an existing one. You can specify the frequency and time of the refresh, as well as any custom options or credentials. New will create a new data source, Connected Workbooks will show you which workbooks use this data source, and Connections will show you which tables or files are connected to this data source. Reference: https://help.tableau.com/current/server/en-us/refresh_extracts.htm https://help.tableau.com/current/server/en-us/refresh_extracts_add.htm
To ensure that the data is updated every hour on Tableau Server, you would need to go to the 'Extract Refreshes' option. Here, you can schedule the data extracts to refresh at the desired frequency, which in this case would be every hour.