Page: 1
/ 14
Total 63 questions
Salesforce Marketing Cloud Intelligence Accredited Professional (AP-215) Exam Questions
Question 1
A client provides the following three files:
File A:

File B:

File C:

File A was uploaded using the Ads data stream type.
The client would like to create this view (data from Files B & C) in Datorama:

Which proposed solution would cause a false connection between the two files?
Answer : C
With File A uploaded using the Ads data stream type, the client wishes to create a view incorporating data from Files B & C.
A false connection would occur if VLOOKUP in Data Stream B is used incorrectly to return ''Day'' and ''Installs''. In this scenario, VLOOKUP might inaccurately link data based on MB Name between File B and File A or File C, which do not have a 'Day' field to correctly join on. Moreover, 'Installs' data in File B doesn't exist, so VLOOKUP cannot correctly return this information. The correct method would be to use the 'Media Buy New Name' to link File B and File C since they both have this field, ensuring accurate connection and avoiding data mismatches or false connections.
Question 2
An implementation engineer has been asked by a client for assistance with the following problem:
The below dataset was ingested:
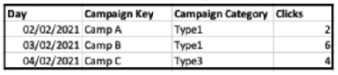
However, when performing QA and querying a pivot table with Campaign Category and Clicks, the value for Type' is 4.
What could be the reason for this discrepancy?
Answer : C
The discrepancy of 'Clicks' being reported as 4 for 'Type1' when the sum of clicks in the dataset for 'Type1' is 8 (2 on 02/02/2021 and 6 on 03/02/2021) suggests that the aggregation function used in the pivot table is set to average (AVG) rather than sum. Salesforce Marketing Cloud Intelligence allows setting different aggregation functions for metrics, and setting it to average would result in such a discrepancy when more than one entry for the same type exists. Reference: Salesforce Marketing Cloud Intelligence documentation on custom measurements and data aggregations explains how to set and understand different aggregation functions.
Question 3
An implementation engineer has been asked to perform QA for a standard file ingestion, done by the client.
The source file that was ingested can be seen below:
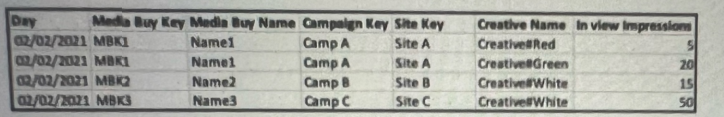
The number of rows added to this data stream is 3. What could have led to this discrepancy?
Answer : D
The source file shows data related to media buys, including a 'Media Buy Key', 'Media Buy Name', 'Campaign Key', and 'Site Key', among other fields. If only three rows were added, and the discrepancy is due to a missing field, it's likely that 'Campaign Key' is the field not mapped, because it is crucial for linking related records in the data stream. Without the 'Campaign Key', the system cannot associate the media buy data with specific campaigns, leading to a potential loss of data rows during ingestion.
Question 4
The following file was uploaded into Marketing Cloud Intelligence as a generic dataset type:
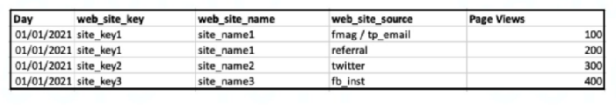
The mapping is as follows:
Day --- Day
Web_site_source --- Main Generic Entity Attribute 01
Page Views --- Generic Metric 1
*Note that 'web_site_key' and 'web_site_name' are NOT mapped.
How many rows will be stored in Marketing Cloud Intelligence after the above file is ingested?
Answer : A
In Marketing Cloud Intelligence, when a file is uploaded as a generic dataset type and mapped accordingly, each unique combination of the mapped fields results in a separate row in the database. The file in question has been mapped with 'Day' to 'Day', 'Web_site_source' to 'Main Generic Entity Attribute 01', and 'Page Views' to 'Generic Metric 1'. The 'web_site_key' and 'web_site_name' are not mapped and thus, won't affect the row count.
Since there are 4 unique combinations of the mapped fields in the uploaded file (each day and source combination is unique), Marketing Cloud Intelligence will store 4 rows after ingestion, corresponding to each unique combination of 'Day' and 'Web_site_source'.
Question 5
An implementation engineer has been provided with 4 different source files: 03m 16s
1. Twitter Ads
2. Creative Classification
3. Placement Classification
4, Campaign Category Classification
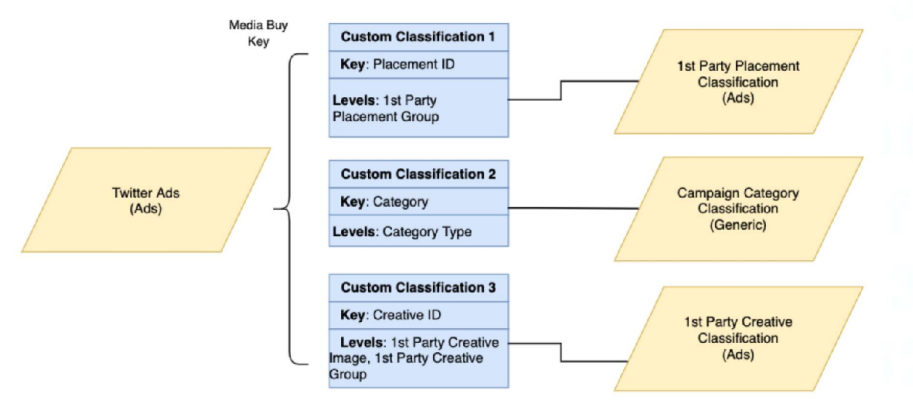
The main source is Twitter Ads (which includes various fields and KPIs), and the rest are classification files that connect to Twitter Ads and enrich different fields within it.
The connections between the files are described as follows:
1st Party Creative Classification
File structure/headers:

Creative ID --- links back to Creative Key (Twitter Ads)
1st Party Placement Classification &
File structure/headers:

Category --- links back to Campaign Category (Twitter Ads)
Which proposed solution meets the client's requirements for the above use case?
A)
B)
C)
D)
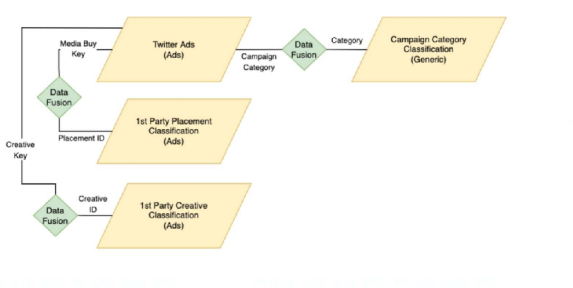
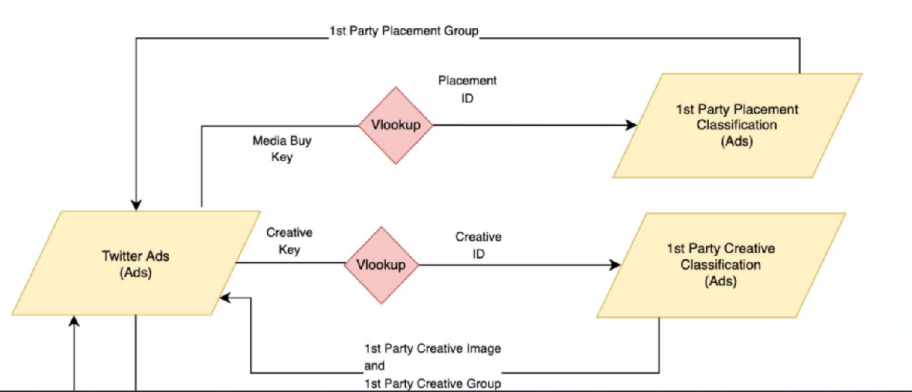
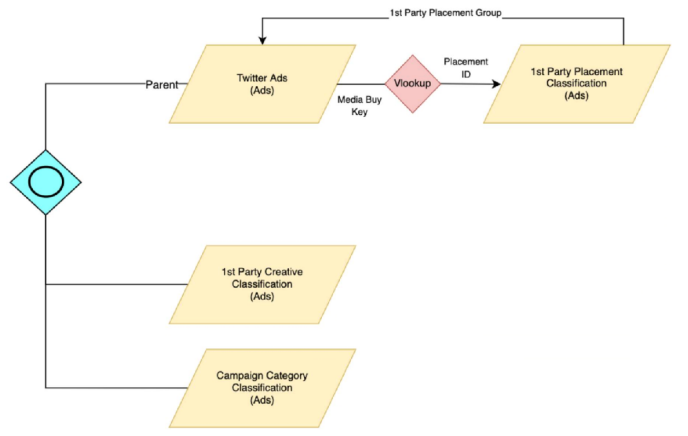
Answer : A
For the given use case, where the Twitter Ads data stream needs to be enriched with classifications from three other sources, the correct implementation would involve creating links between the various fields across these files.
Option A is correct because it shows the correct usage of the fields from the classification files:
'Creative ID' in the Creative Classification file is linked to the 'Creative Key' in the Twitter Ads data, allowing for enrichment with creative details.
'Placement ID' in the Placement Classification file is linked to a corresponding field in the Twitter Ads data, allowing for placement details to be added.
'Category' in the Campaign Category Classification file is linked back to 'Campaign Category' in the Twitter Ads data, thus enriching the campaign data with the correct categories.
This configuration correctly uses VLOOKUP to enrich the Twitter Ads data stream with additional details from the classification files, aligning with best practices for data integration and enrichment in Marketing Cloud Intelligence.
Question 6
What is the relationship between "Media Buy Key" and "Creative Key?
Answer : A
In Marketing Cloud Intelligence, the 'Media Buy Key' is typically associated with the purchase details of a media campaign, such as the platform, audience, and budget. The 'Creative Key' relates to the specific creative asset used within a campaign, like an image, video, or text. A single media buy can have multiple creative variations to test performance or to target different audiences, leading to a one-to-many relationship.
Question 7
An implementation engineer is requested to apply the following logic:
To apply the above logic, the engineer used only the Harmonization Center, without any mapping manipulations. What is the minimum amount of Patterns creating both 'Platform' and 'Line of Business'?"
Answer : B
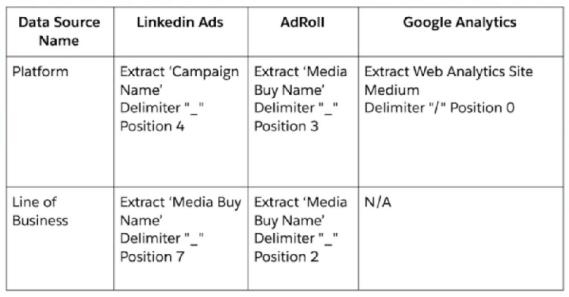
To create both 'Platform' and 'Line of Business' fields using Patterns in the Harmonization Center without mapping manipulations, the engineer would need to create separate patterns for each data source mentioned. According to the provided images:
One pattern for LinkedIn Ads, to extract the 'Campaign Name' at position 4 for the Platform and 'Media Buy Name' at position 7 for Line of Business.
One pattern for AdRoll, to extract 'Media Buy Name' at position 3 for Platform and at position 2 for Line of Business.
One pattern for Google Analytics, which seems not required for the Platform but could apply if the Line of Business extraction is necessary, although it states N/A.
Hence, a minimum of 3 patterns would be necessary to create the fields required.