Page: 1
/ 14
Total 108 questions
Tableau Desktop Certified Associate Exam Questions
Question 1
You are unable to join two tables because tableau throws the type mismatch error. How you can solve it most likely?
Answer : C
Use join Calculations while joining two tables.
Question 2
Which of the following are true when you use the cube data source in Tableau?
Answer : A, C, D
Cube data sources can only be used as the primary data source for blending data in Tableau.
All others are true.
Refer: https://help.tableau.com/current/pro/desktop/en-us/cubes.htm
Question 3
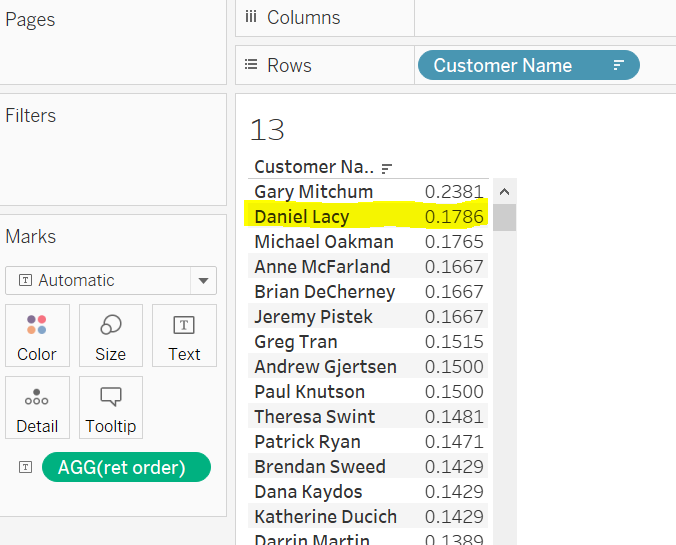
Connect to the "Global Superstore" data source and find out which 'Customer Name' (ignore the customer ID) has returned the highest percentage of his\her orders?
Answer : B
Left join the Orders and Returns table

Number of orders returned will be order ID from the returns table divide by total orders
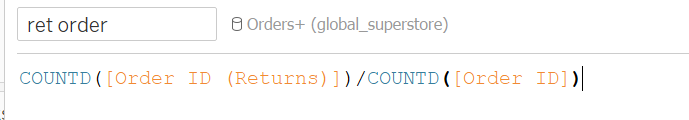
Drop the customer name and ret order field in the view.

Question 4
Connect to the "Covid data" source. Create a line chart using continuous months and new deaths. Find the Excess Kurtosis for the sum of new deaths.
Answer : B
Drop the Date to the columns and select the continuous month. Drop New Deaths to rows.
Click on the Show/Hide card and enable the Summary Card.
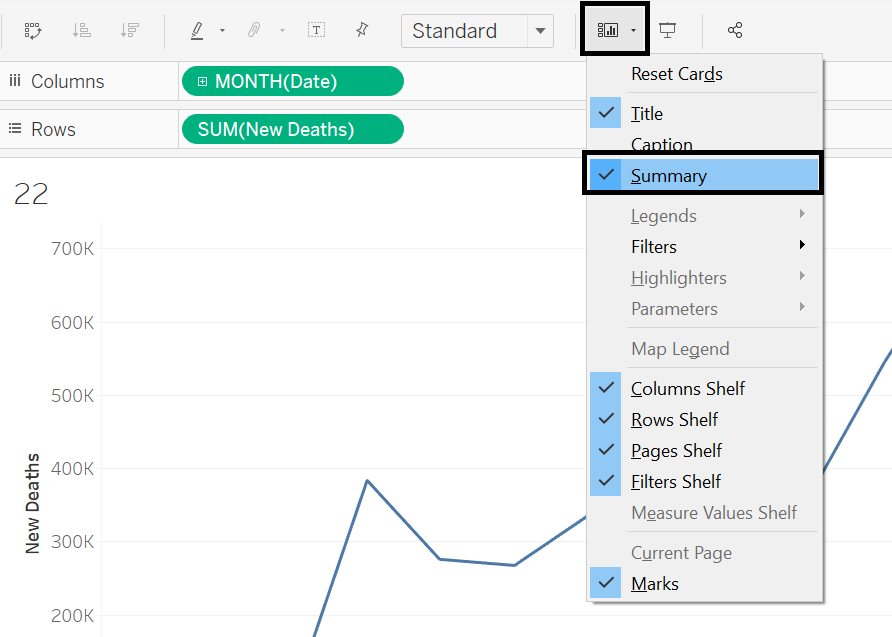
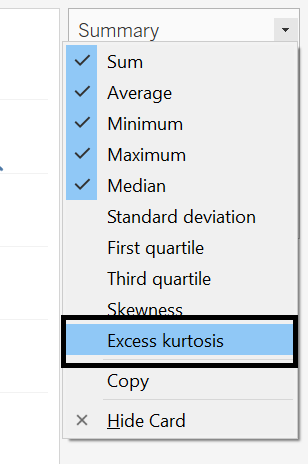
You will see the Summary Card on the right, if Excess Kurtosis is not enabled, click on the drop-down and select the Excess Kurtosis.
Question 5
In LOD calculation, we can use fields from multiple data sources (blended data source)?
Answer : B
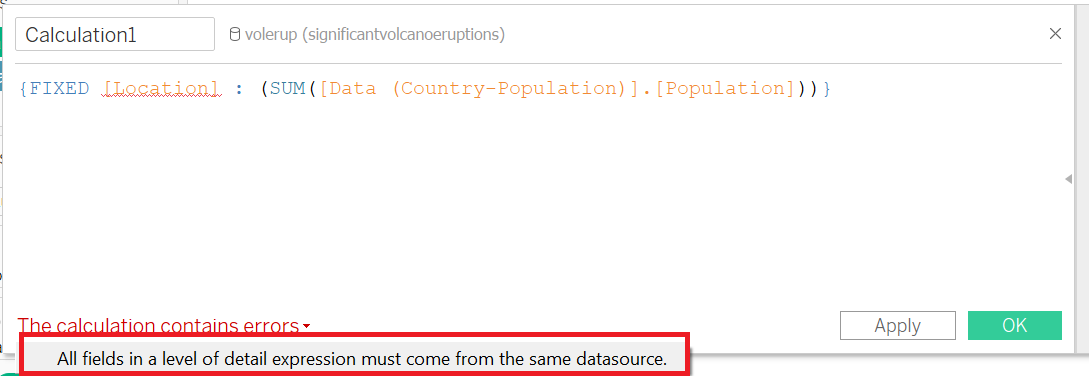
Here, the Location is in a primary data source, and the population field is in a secondary data source.
So the answer is FALSE.
Question 6
Which type of sort is applied in the Ship Mode field?
Larger image
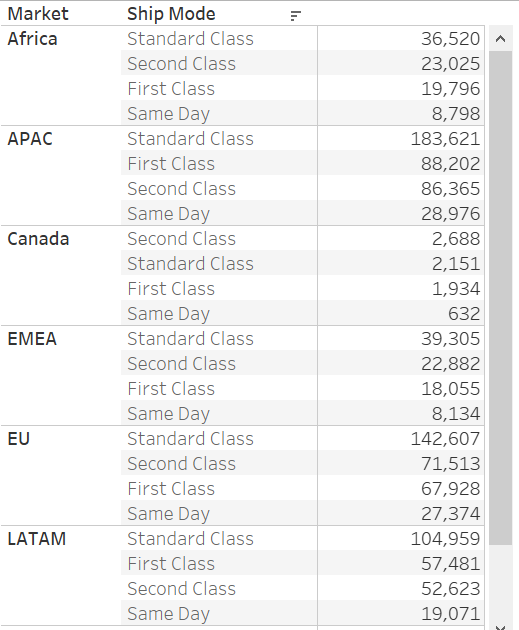
Answer : B
Refer to Nested Sort section: https://help.tableau.com/current/pro/desktop/en-us/sortgroup_sorting_computed_howto.htm
Question 7
Connect to the "Global Superstore" data source and use the Orders table. Find out the customers who placed their first order in 2013 and what is the total sales value of these customers in the same year?
Answer : C
Find the minimum order date for each customer
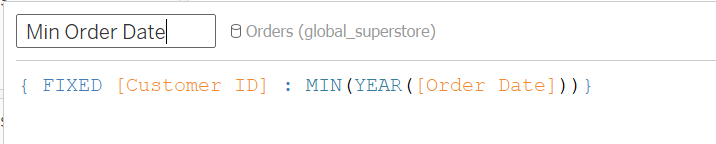
Drop the order date, Min Order date, and Sales to the view
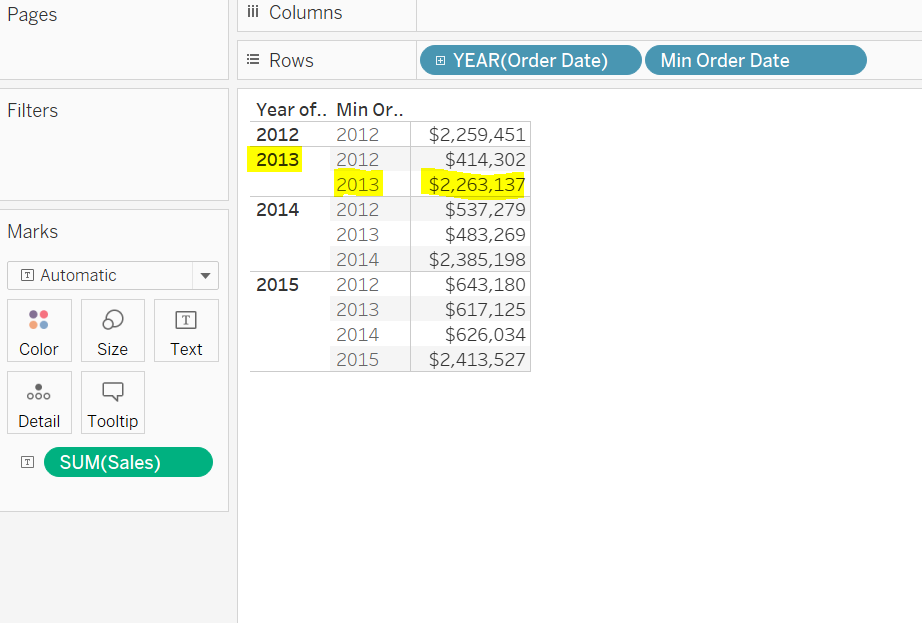
$2,263,137 is the sales value in 2013 of the customers who placed their first order in 2013.