Page: 1
/ 14
Total 317 questions
Tableau Desktop Specialist TDS-C01 Exam Questions
Question 1
True or False: A LEFT JOIN or INNER JOIN creates a row each time the join criteria is satisfied, which can result in duplicate rows. One way to avoid this is to use data blending instead.
Answer : A
Joins combine tables by adding more columns of data across similar row structures. This can cause data loss or duplication if tables are at different levels of detail, and joined data sources must be fixed before analysis can begin.
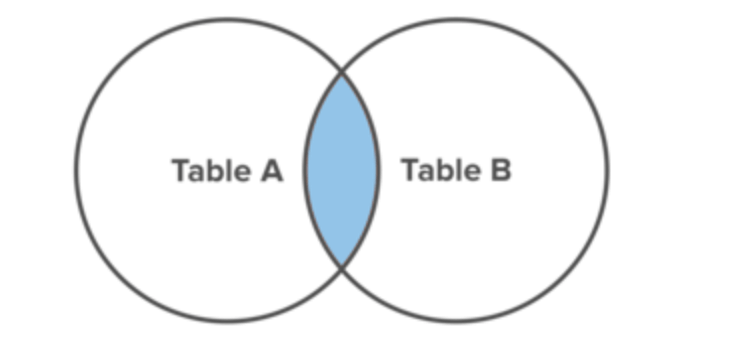
Inner join
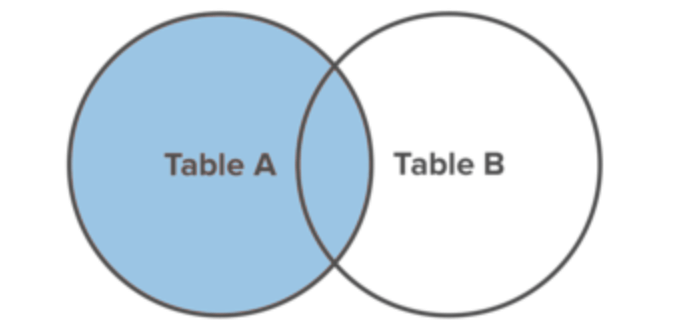
Left Join
Blends, unlike relationships or joins, never truly combine the data. Instead, blends query each data source independently, the results are aggregated to the appropriate level, then the results are presented visually together in the view.
Question 2
How can you create a packaged data source?
Answer : B
To create a packaged data source (.tdsx file) in Tableau, you would right-click on the data connection in the Data pane and select the option to add it to saved data sources. This action packages the data source with the metadata that you've defined in Tableau, such as calculations, groups, and sets, so that you can easily share it with others. This does not package the data itself, which is a separate step if you're working with local file-based data.
Question 3
Which three statements accurately describe dimensions? Choose three.
Answer : A, B, E
Three statements that accurately describe dimensions are: Contain qualitative values Affect the level of detail in the view Can be continuous or discrete Dimensions are fields that contain qualitative values, such as names, dates, or geographical data. You can use dimensions to categorize, segment, and reveal the details in your data. Dimensions affect the level of detail in the view by creating headers or labels for marks or by defining how data is partitioned for table calculations. Dimensions can be continuous or discrete depending on their data type and format. Continuous dimensions are those that have an infinite range of possible values, such as numbers or ratios.Discrete dimensions are those that have a finite number of distinct values, such as names, categories, or dates3The other options are not accurate statements about dimensions. Contain numeric, quantitative values is not correct, because fields that contain numeric, quantitative values are measures, not dimensions. Measures are fields that contain numeric values that you can measure and aggregate. Affect the formatting options in the view is not correct, because formatting options are not determined by dimensions, but rather by user preferences and choices.Formatting options allow you to change the appearance of various elements in the workbook, such as fonts, borders, shading, alignment, etc3
Question 4
You have cleaned a data source properly, created some calculated fields and renamed some columns. You want to save these changes for future use cases. Which of the following would BEST satisfy this requirement?
Answer : C
After making changes to Data, we can save that new data source as a .tds file. To do so, go to data menu on top and then choose your current connected data source. Then next click on Add to Saved Data sources. This will save all calculated fields, changes to fields etc. It will be saved in My Tableau Repository -> Mydatasources. This will then also appear on Tableau Home Page under saved data sources like SampleSuperStore.
Note: Data source files do not contain the actual data but rather the information necessary to connect to the actual data as well as any modifications you've made on top of the actual data such as changing default properties, creating calculated fields, adding groups, and so on.
.twb and .twbx are not the BEST solutions since the questions nowhere mentions that we need to store our workbooks as well.
.twm is a bookmark which contains a single worksheet and are an easy way to quickly share your work.
Question 5
Which of the following is a valid way to create Sets in Tableau?
Answer : A
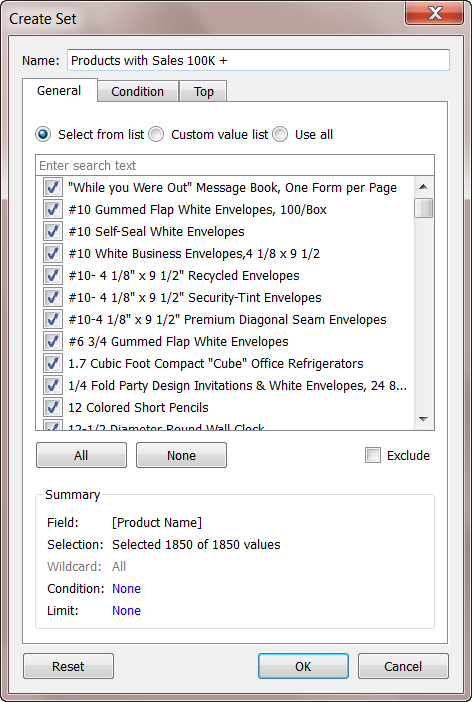
There are two types of sets: dynamic sets and fixed sets. The members of a dynamic set change when the underlying data changes. Dynamic sets can only be based on a single dimension.
To create a dynamic set:
1) In the Data pane, right-click a dimension and select Create > Set.
2) In the Create Set dialog box, configure your set. You can configure your set using the following tabs:
General: Use the General tab to select one or more values that will be considered when computing the set.
You can alternatively select the Use all option to always consider all members even when new members are added or removed.
None of the other options exist, and therefore are incorrect answers.
Question 6
True or False: The Highlighting action can be disabled for the entire workbook.
Answer : A
Yes, it is possible to disable highlighting for the entire workbook.
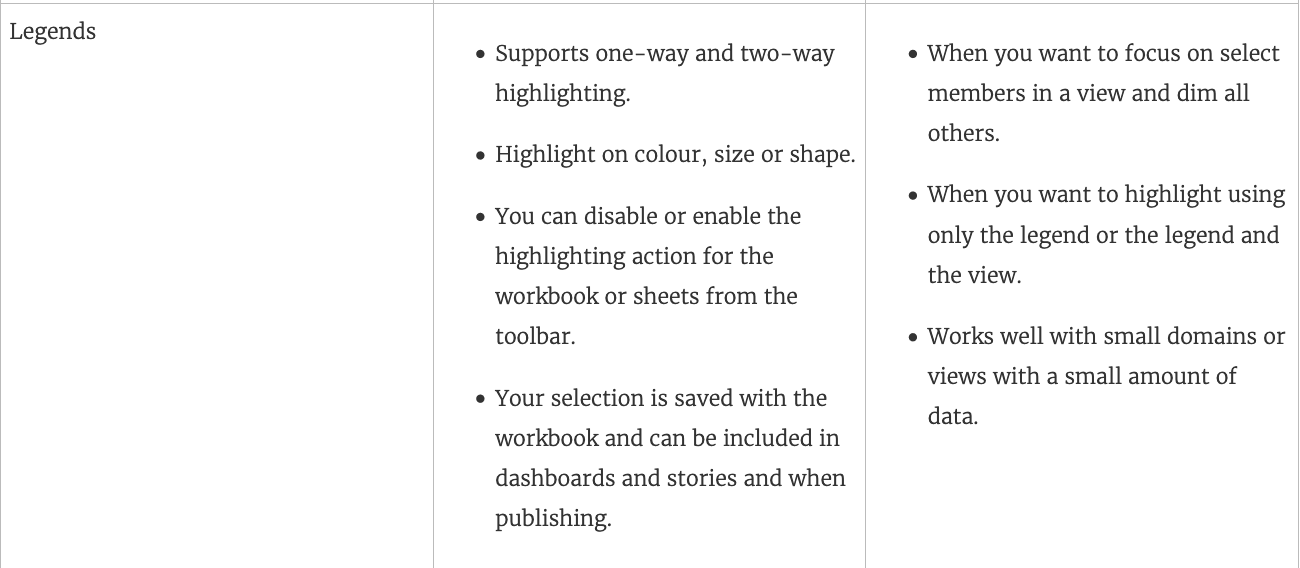
For more information :https://help.tableau.com/current/pro/desktop/en-gb/actions_highlight.htm
Question 7
Which two statements accurately describe a visualization animation? Choose two
Answer : A, B
Visualization animations in Tableau can highlight changing patterns in data and can be either simultaneous or sequential:
A . Highlights changing patterns in data:
Visualization animations are designed to highlight changes in data over time or as filters are applied. They help users to see how data trends and patterns evolve.
B . Can be simultaneous or sequential:
Animations in Tableau can be configured to play simultaneously or sequentially. Simultaneous animations play all changes at once, while sequential animations play changes one after the other, allowing for a step-by-step view of data transformations.
Incorrect options:
C . Can be applied to map visualizations: While animations can be applied to map visualizations, the statement is not one of the two correct descriptions of visualization animations as per the question context.
D . Uses the Pages shelf: The Pages shelf is used for creating page animations, which is a different concept from visualization animations.
Tableau's official documentation on animations: Formatting Animations