Page: 1
/ 14
Total 174 questions
Salesforce Certified Tableau Data Analyst Analytics-DA-201 Exam Questions
Question 1
You have the following view.
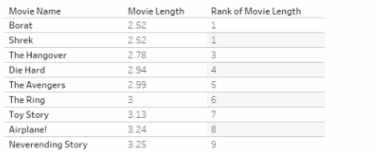
You want to filter the view lo show only records that have a movie name starting with the word. "The". You must achieve the goal without writing any formulas.
Which type of filter should you use?
Answer : A
Question 2
SIMULATION
Open the link to Book1 found on the desktop. Use the Superstore data source.
Split the Customer Name field into two fields named First Name and Last Name.
Answer : A
To split the Customer Name field into two fields named First Name and Last Name, you need to do the following steps:
Open the link to Book1 found on the desktop. This will open the Tableau workbook that uses the Superstore data source.
Go to the Data Source tab at the bottom of the workbook to see the data source page. You will see a table that shows the fields and values from the Superstore data source.
Right-click on Customer Name in the table and select Split from the menu. This will split the field into two fields based on a separator, which is a space by default. You will see two new fields named Customer Name - Split 1 and Customer Name - Split 2 in the table.
Right-click on Customer Name - Split 1 and select Rename from the menu. Type First Name as the new name and press Enter. This will rename the field as First Name.
Right-click on Customer Name - Split 2 and select Rename from the menu. Type Last Name as the new name and press Enter. This will rename the field as Last Name.
Question 3
A Data Analyst has a data source that has two tables named Table1 and Table2. Table1 is the primary table and Table2 is the secondary table.
The analyst wants to combine the tables by using Tableau Prep. The combined table must include only values from Table1 that do not match any values in Table2. The field values from Table2 must appear as null values.
Which type of join should the analyst use?
Answer : B
Question 4
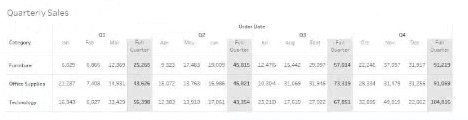
Which option must a Data Analyst enable to build the following table to add quarterly totals?
Answer : A
Question 5
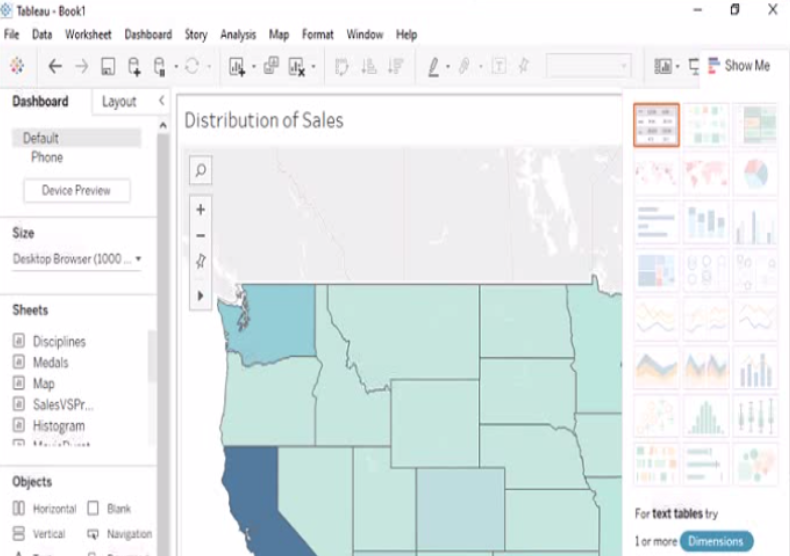
A Data Analyst needs to develop a Sales Dashboard that users can access through a computer or by phone and tablet using the same URL link.
How should the analyst create dashboards that are formatted for specific devices?
Answer : B
Question 6
A Data Analyst has a data source that contains data for every city in the United States. The following is a sample of the data.
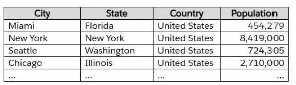
The analyst needs to use the City dimension to create a dynamic filter that shows the cities that have a population greater than 1 million.
Which type of filter should the analyst use?
Answer : C
Question 7
You have a dashboard that contains a parameter named Start Date.
You need to create an extract from a Microsoft Excel file. The extract must be filtered based on Start Date.
What should you do?
Answer : A